1.Introduction
LT Auditor+ App for Splunk is a Splunk app that is optimized to receive data from LT Auditor+ agents. The App has Intelligent dashboards with drilldown capabilities to provide a complete view of change activity on Active Directory, Group Policy, Servers, File Shares, Endpoints, USB Flash Drives in an organization.
2.Why use LT Auditor+ App for Splunk
Most SIEM systems including Splunk scrapes native Windows logs to collect information on Active Directory, GPO and file share activity. The volume of data generated in raw logs is huge and this information have several limitations such as:
- High volume of clutter and noise making it difficult access valuable and critical information;
- Does not provide a complete audit trail like showing who did what from where and when for changes to user identities, policies and access to critical files;
- Very limited information on changes to Group Policies. Understanding what attributes were changed on vital GPO policies is critical in ensuring that the network has not been compromised. This information is not available in the event logs.
Core benefits of ingesting data from LT Auditor+ are:
- Creation of complex filters to determine what type of audit data is sent to Splunk. This improves the quality of data as well as dramatically reducing noise and clutter;
- Comprehensively audit modifications to Active Directory, Group Policies, File Shares and USB Flash Drives;
- FFIEC, NIST, PCI-DSS, HIPAA and SOX compliance reports;
- Provides information on Active Directory audits such as Group Memberships, Last Logons, Password Settings, Account Settings and Security Permissions;
- Reduces requirements to understand complex Spunk queries, Windows event ids and makes investigation for security incidents easier for security professionals.
3.Installation
The following section describes how to install LT Auditor+ App for Splunk across single and distributed instances of Splunk.
Download LT Auditor+ App for Splunk and extract contents to reveal the following two files:
- Single Instance/lt-auditor-app-for-splunk.tar.gz
- Distributed Environment/lt-auditor-app-for-splunk.tar.gz
- Distributed Environment/ta-lt-auditor.tar.gz
3.1.Single Instance Installation
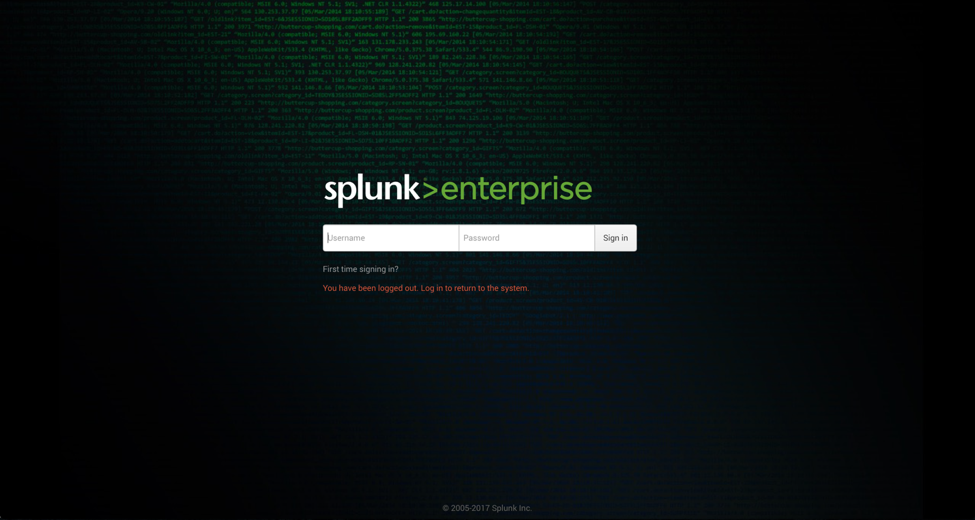
- Login in to your Splunk console
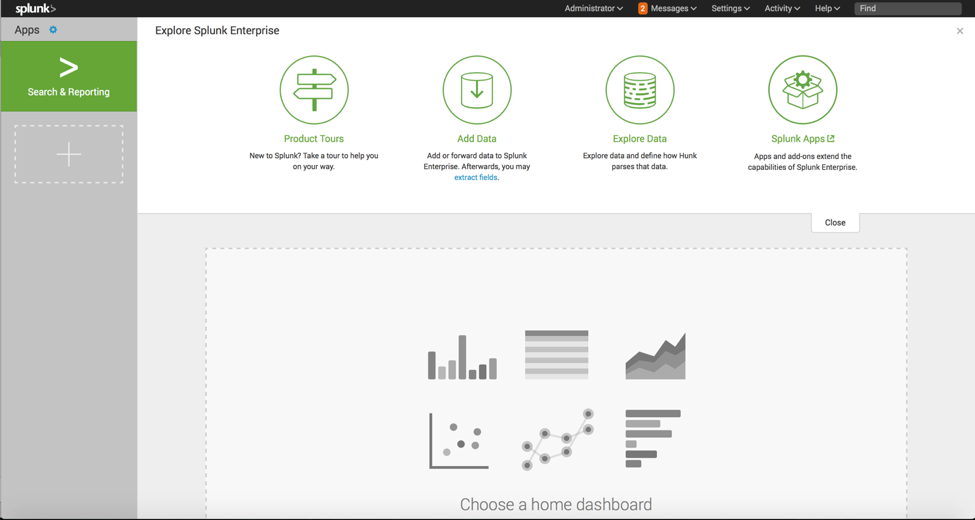
- Access the Splunk home page
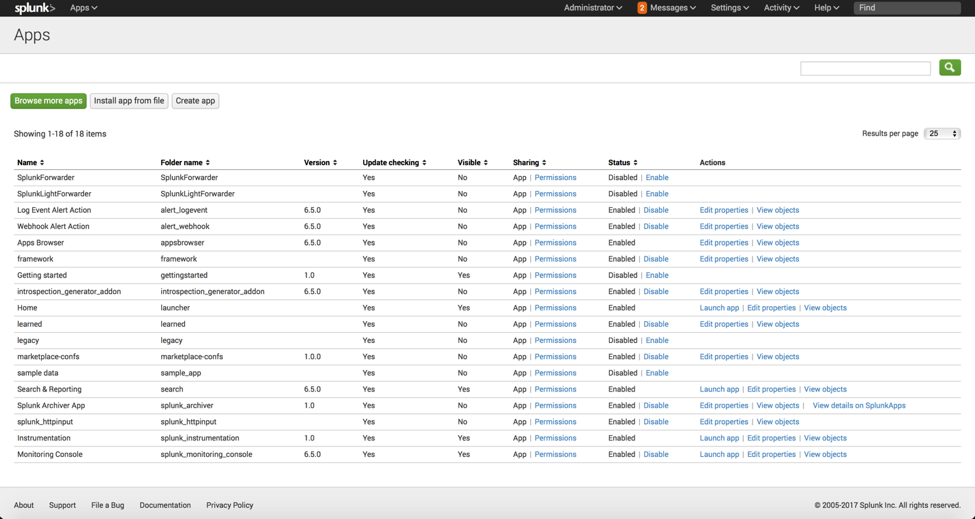
- Click on the Apps icon to open Apps screen as shown below:
- Click ‘Install app from file’ to open the screen ‘Upload an app’:
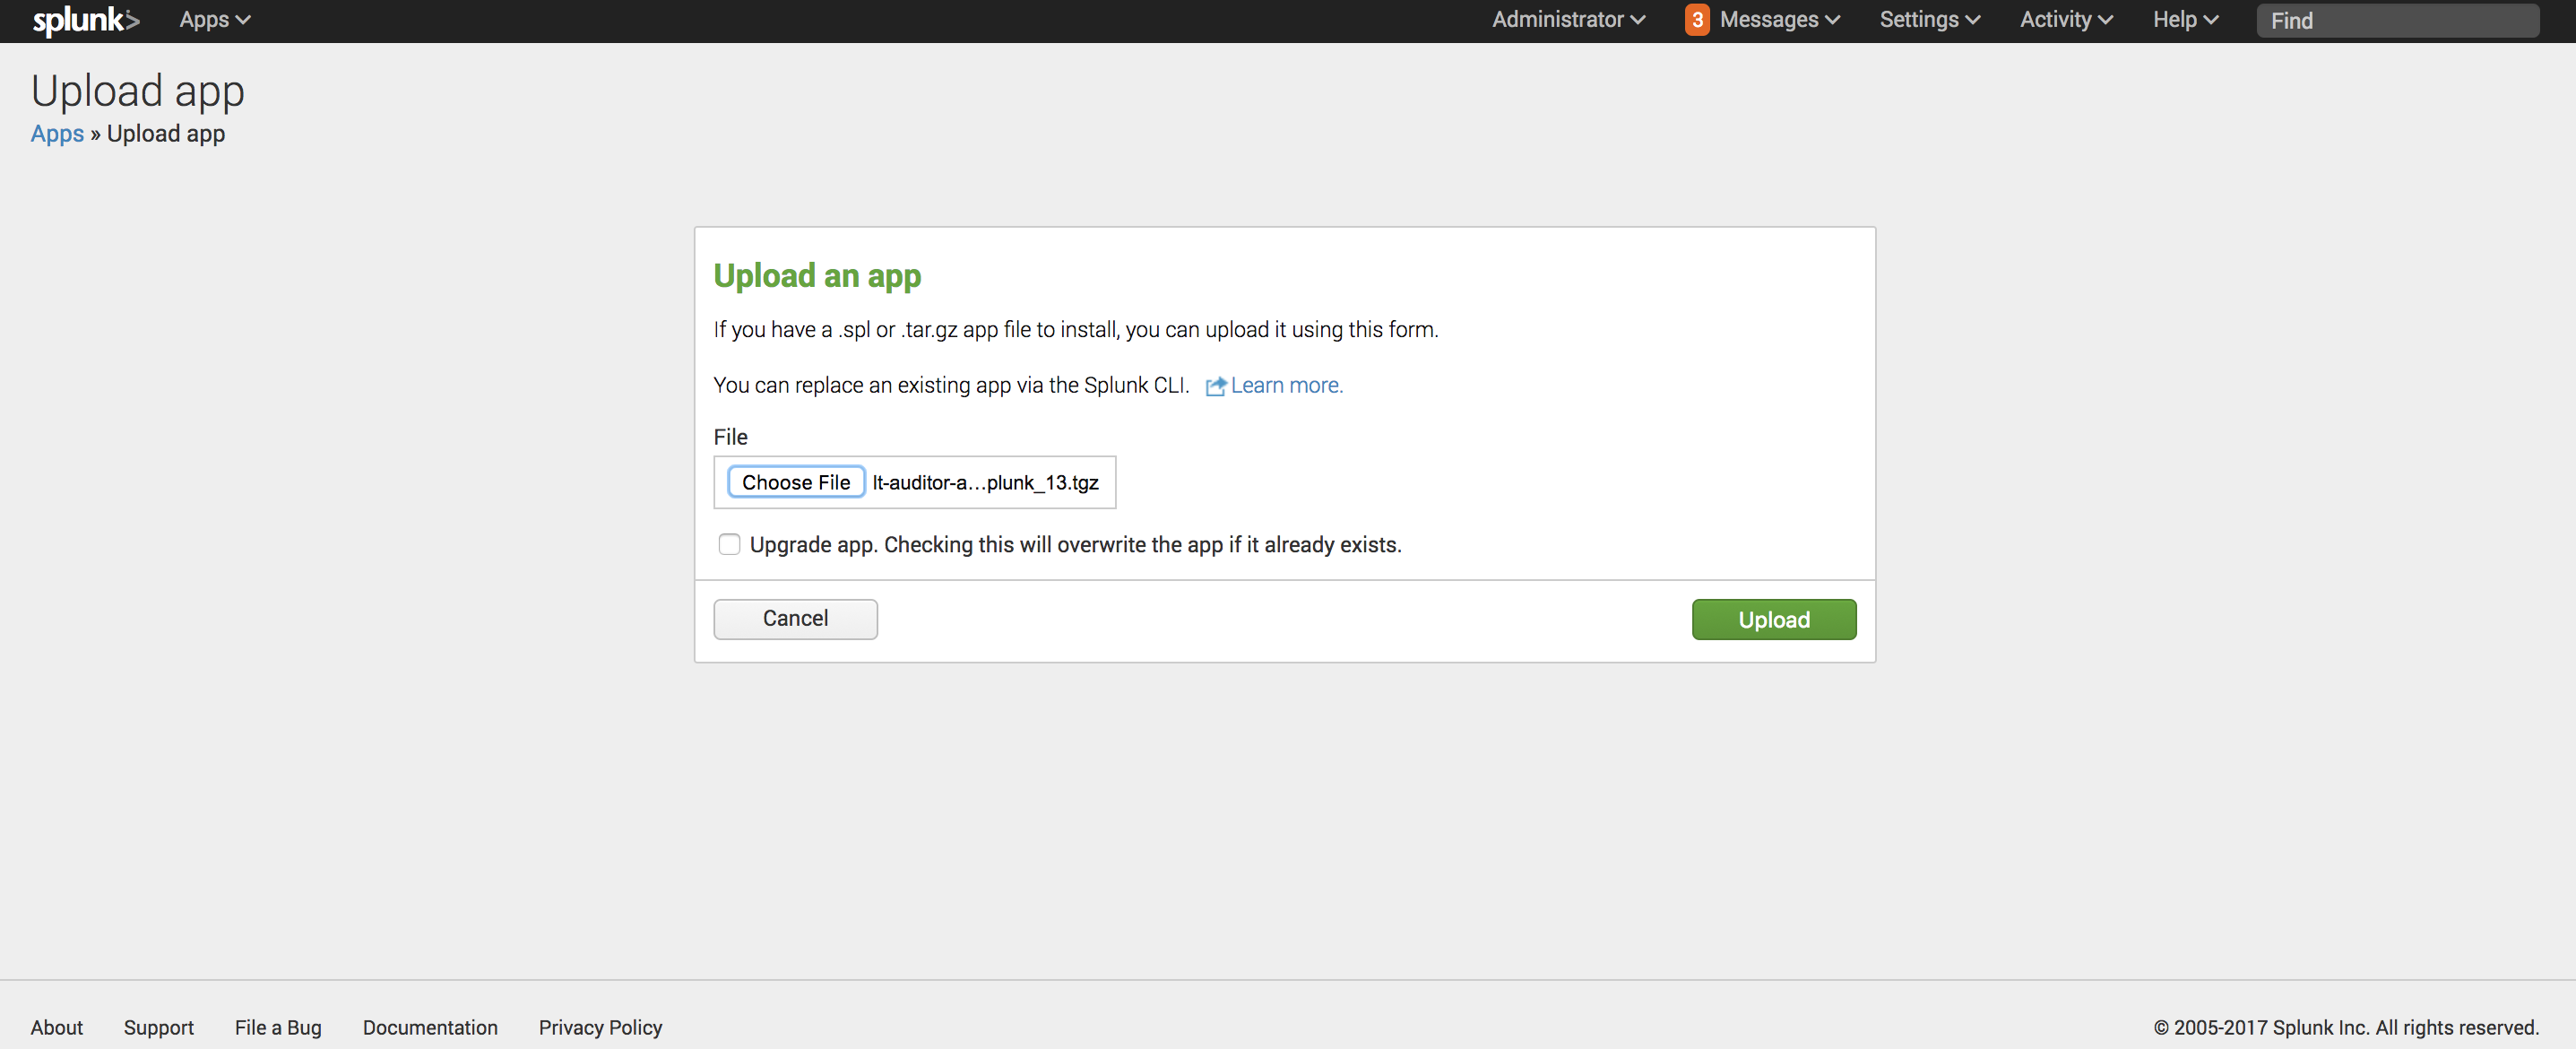
- Browse to the file lt-auditor-app-for-splunk.tar.gz and select upload

- You will now see the LT Auditor+ App for Splunk and LT Auditor+ Add-on for Splunk installed as shown below:

- Click the Splunk icon to switch to the Home page and you will now see the new App – LT Auditor+ App for Splunk.
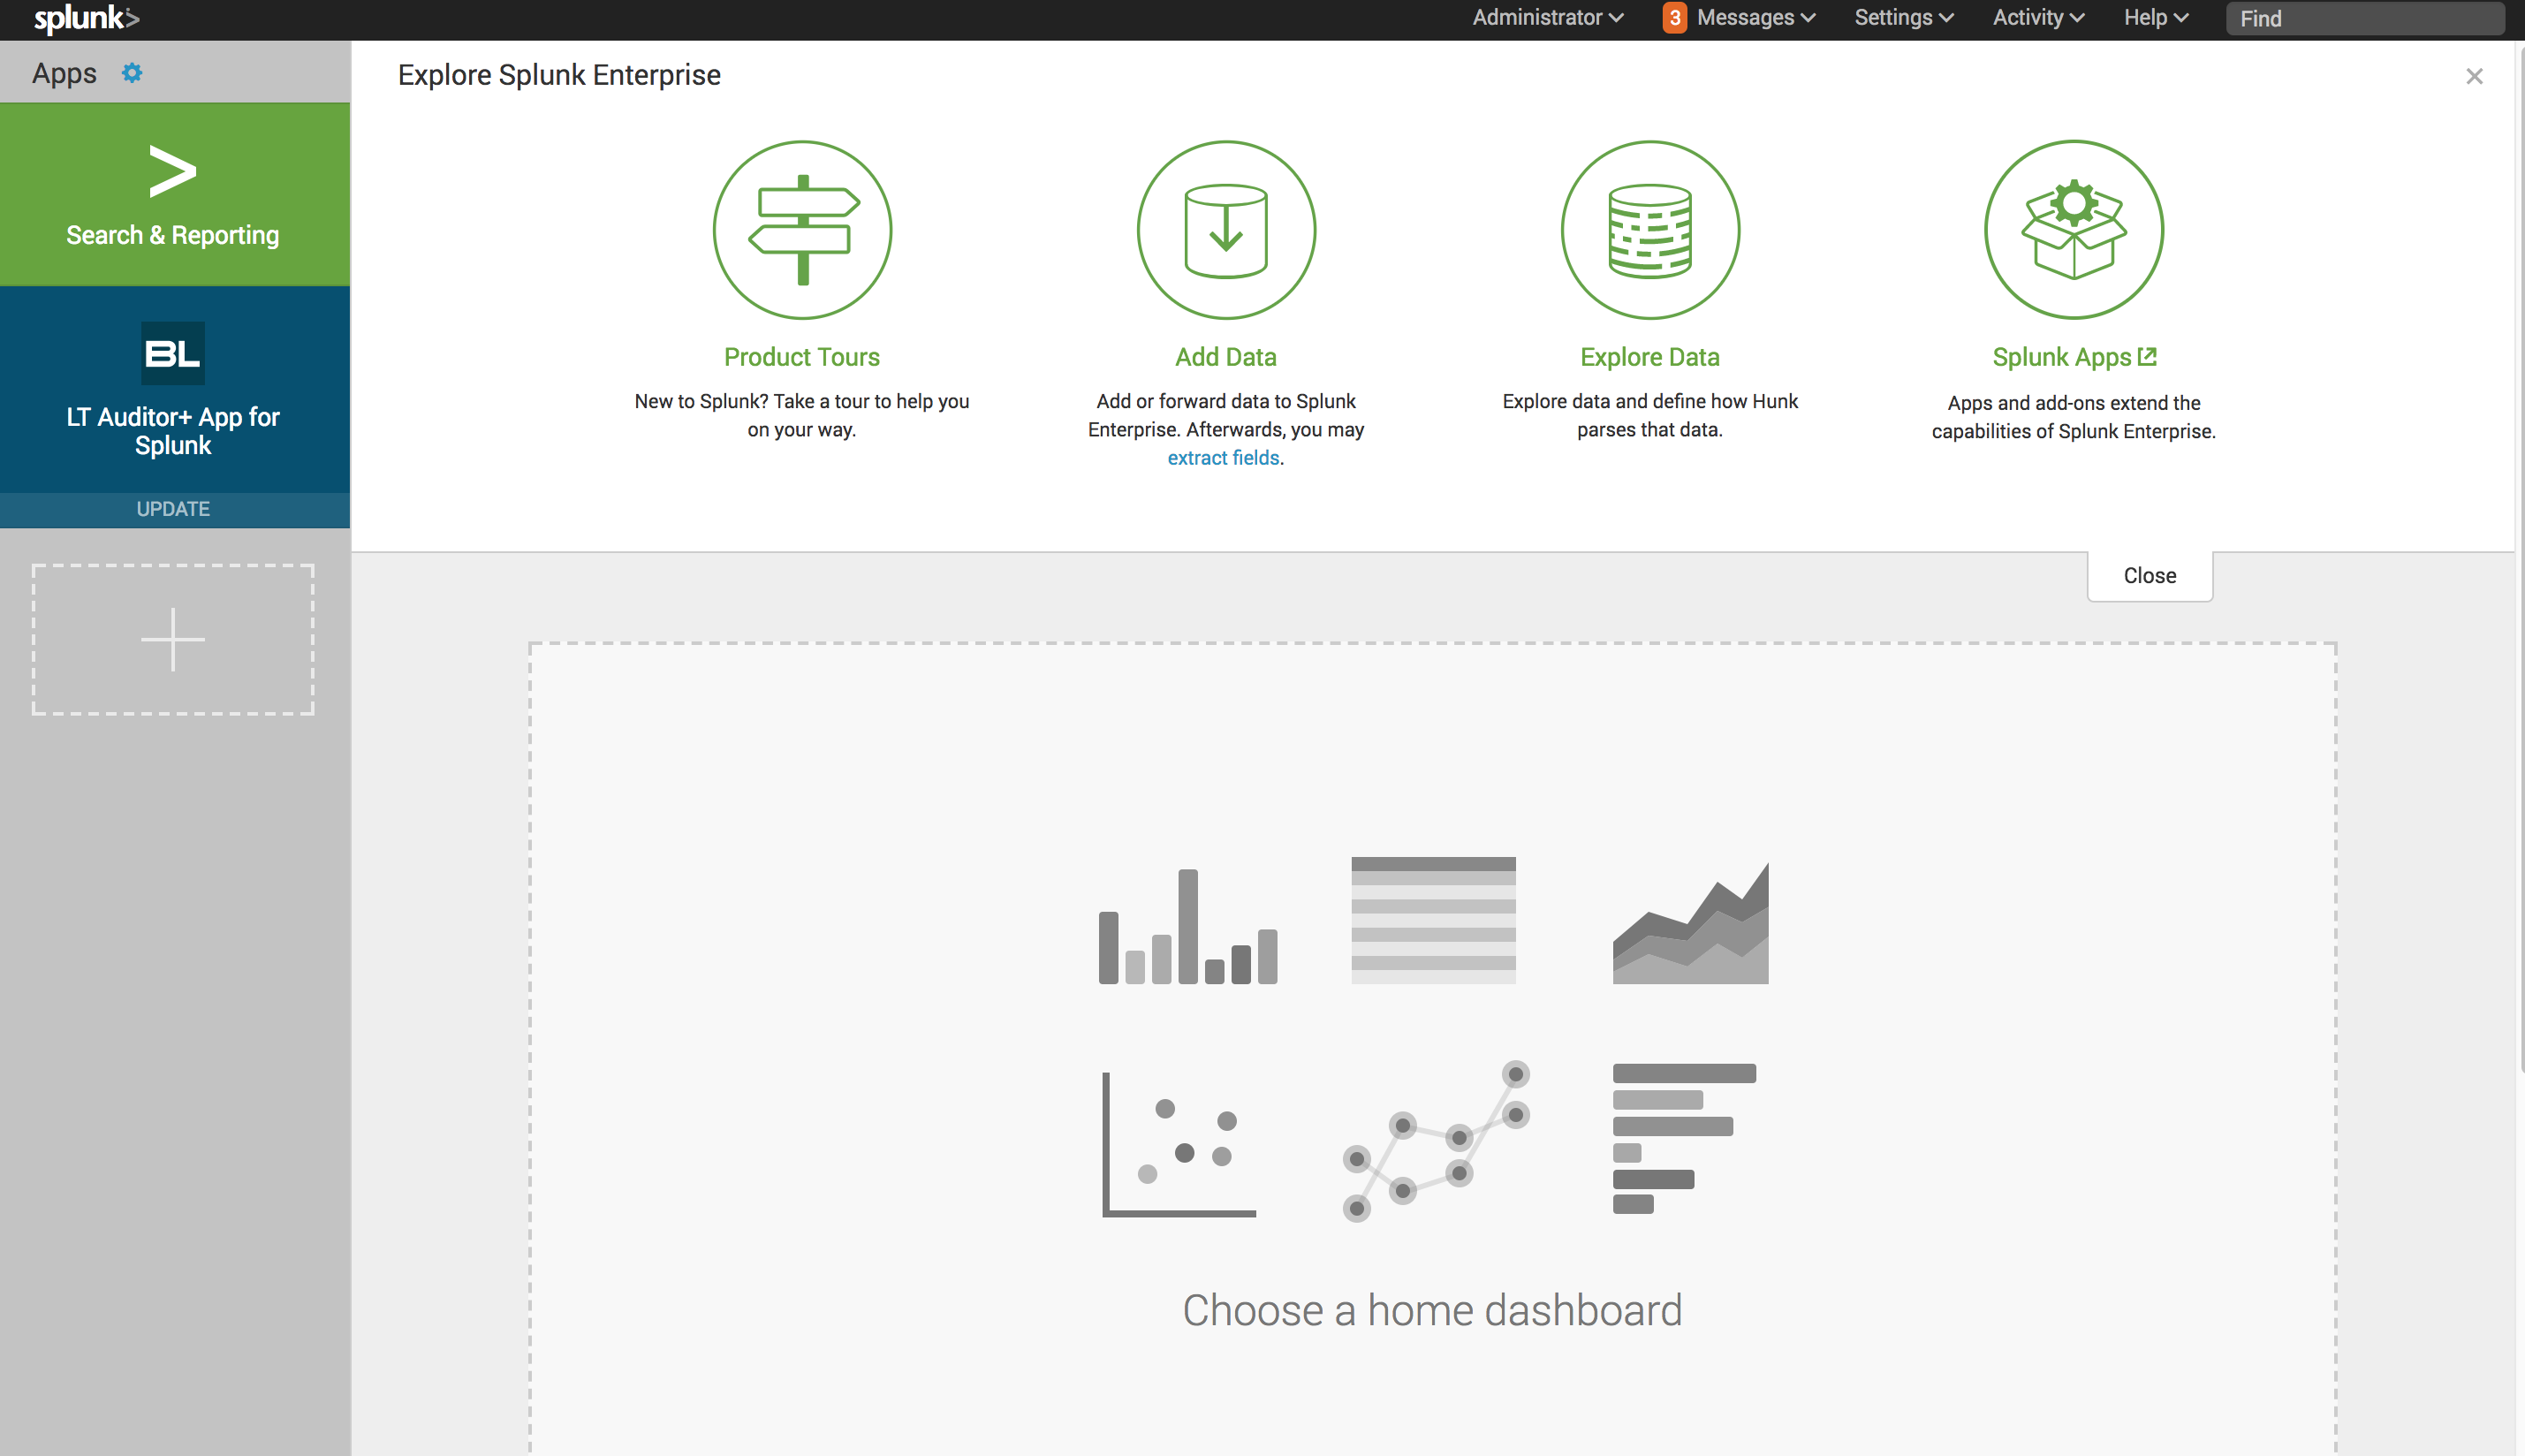
3.1.1.Configuration Steps in Splunk
8. Click Settings->Indexes->New Index and set the following:
- Index Name: lt_auditor_idx
- App: LT Auditor+ App for Splunk
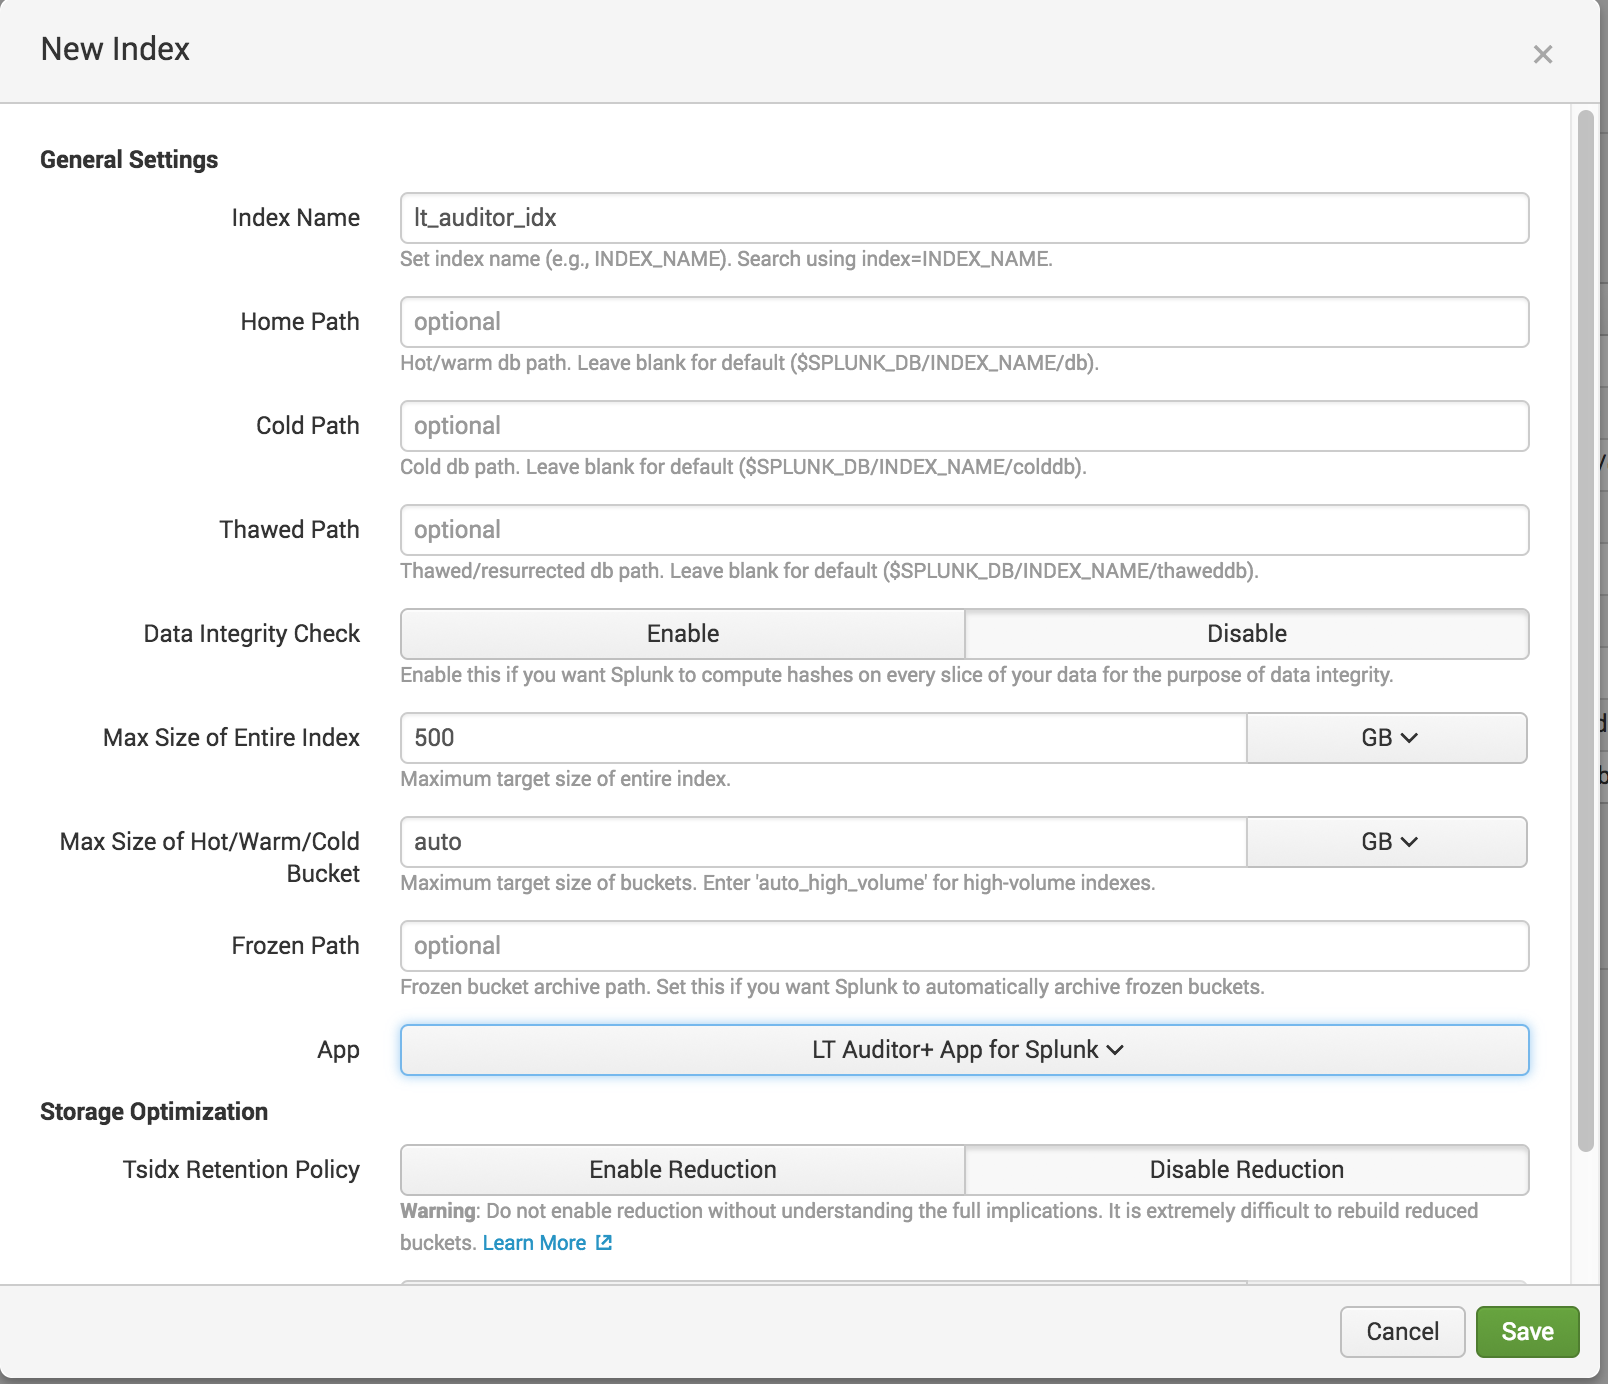
- Click Save
9. Click Settings->Data inputs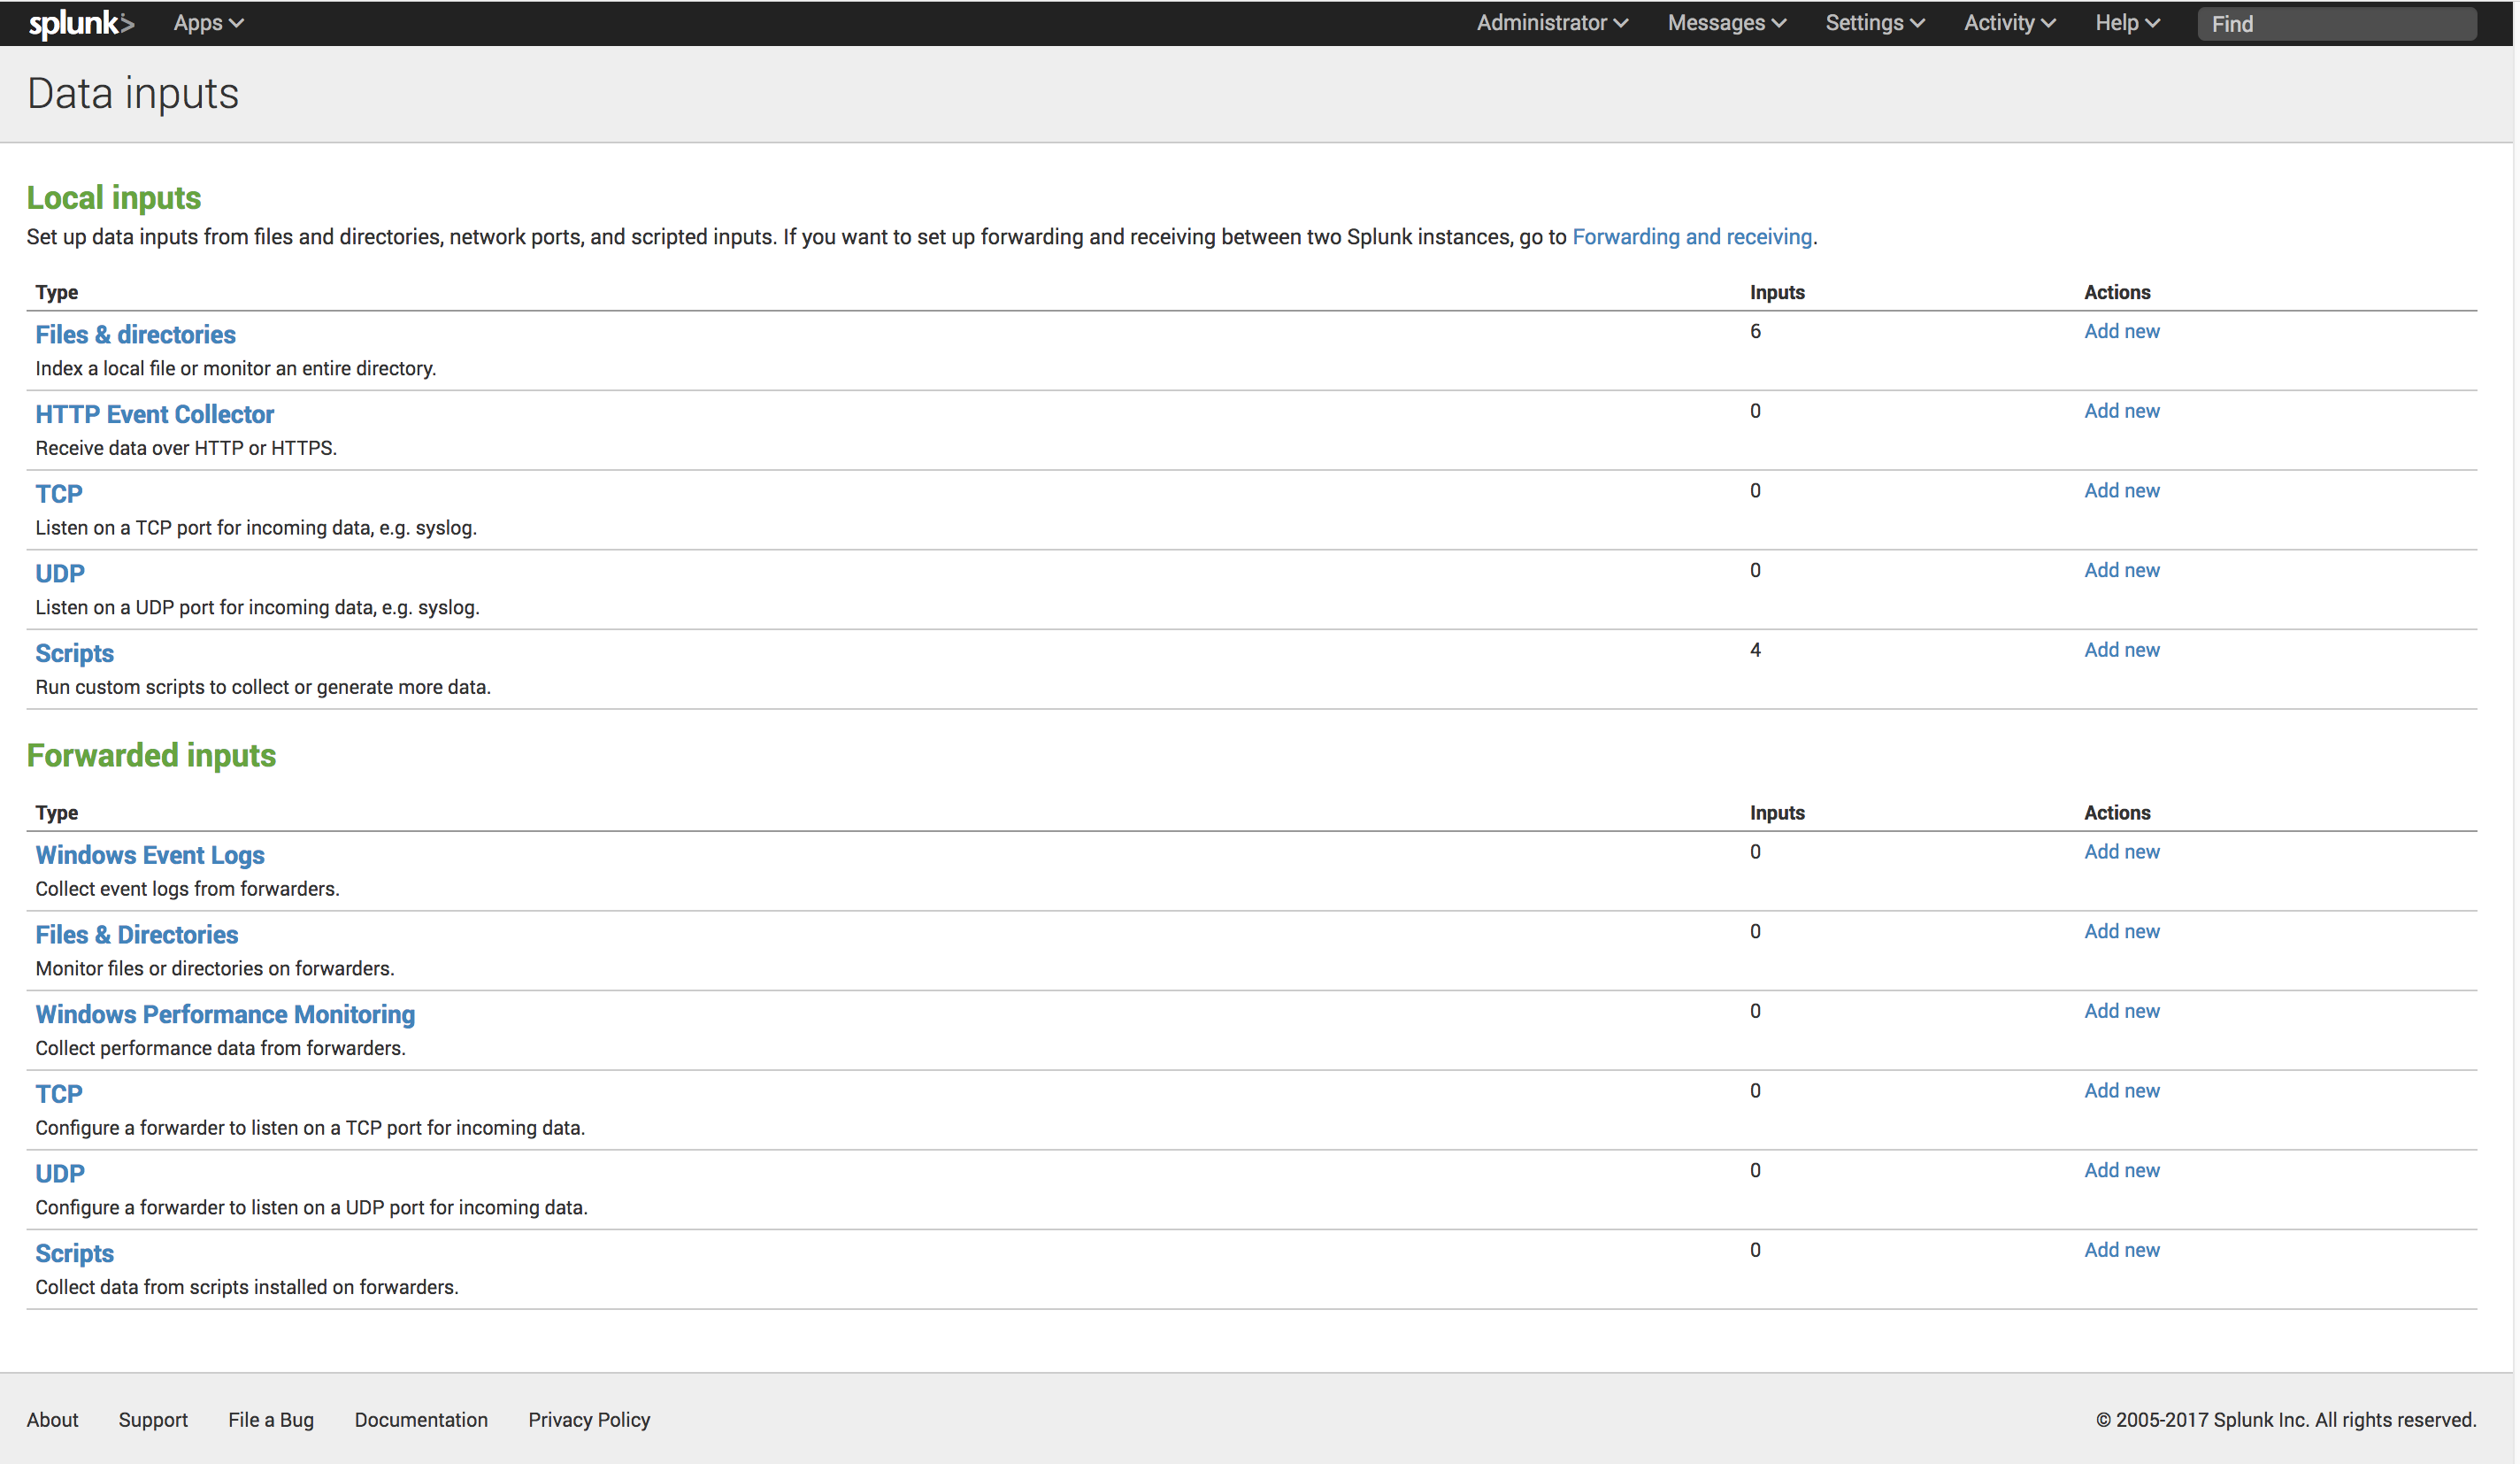
10. For Local inputs/TCP click Add new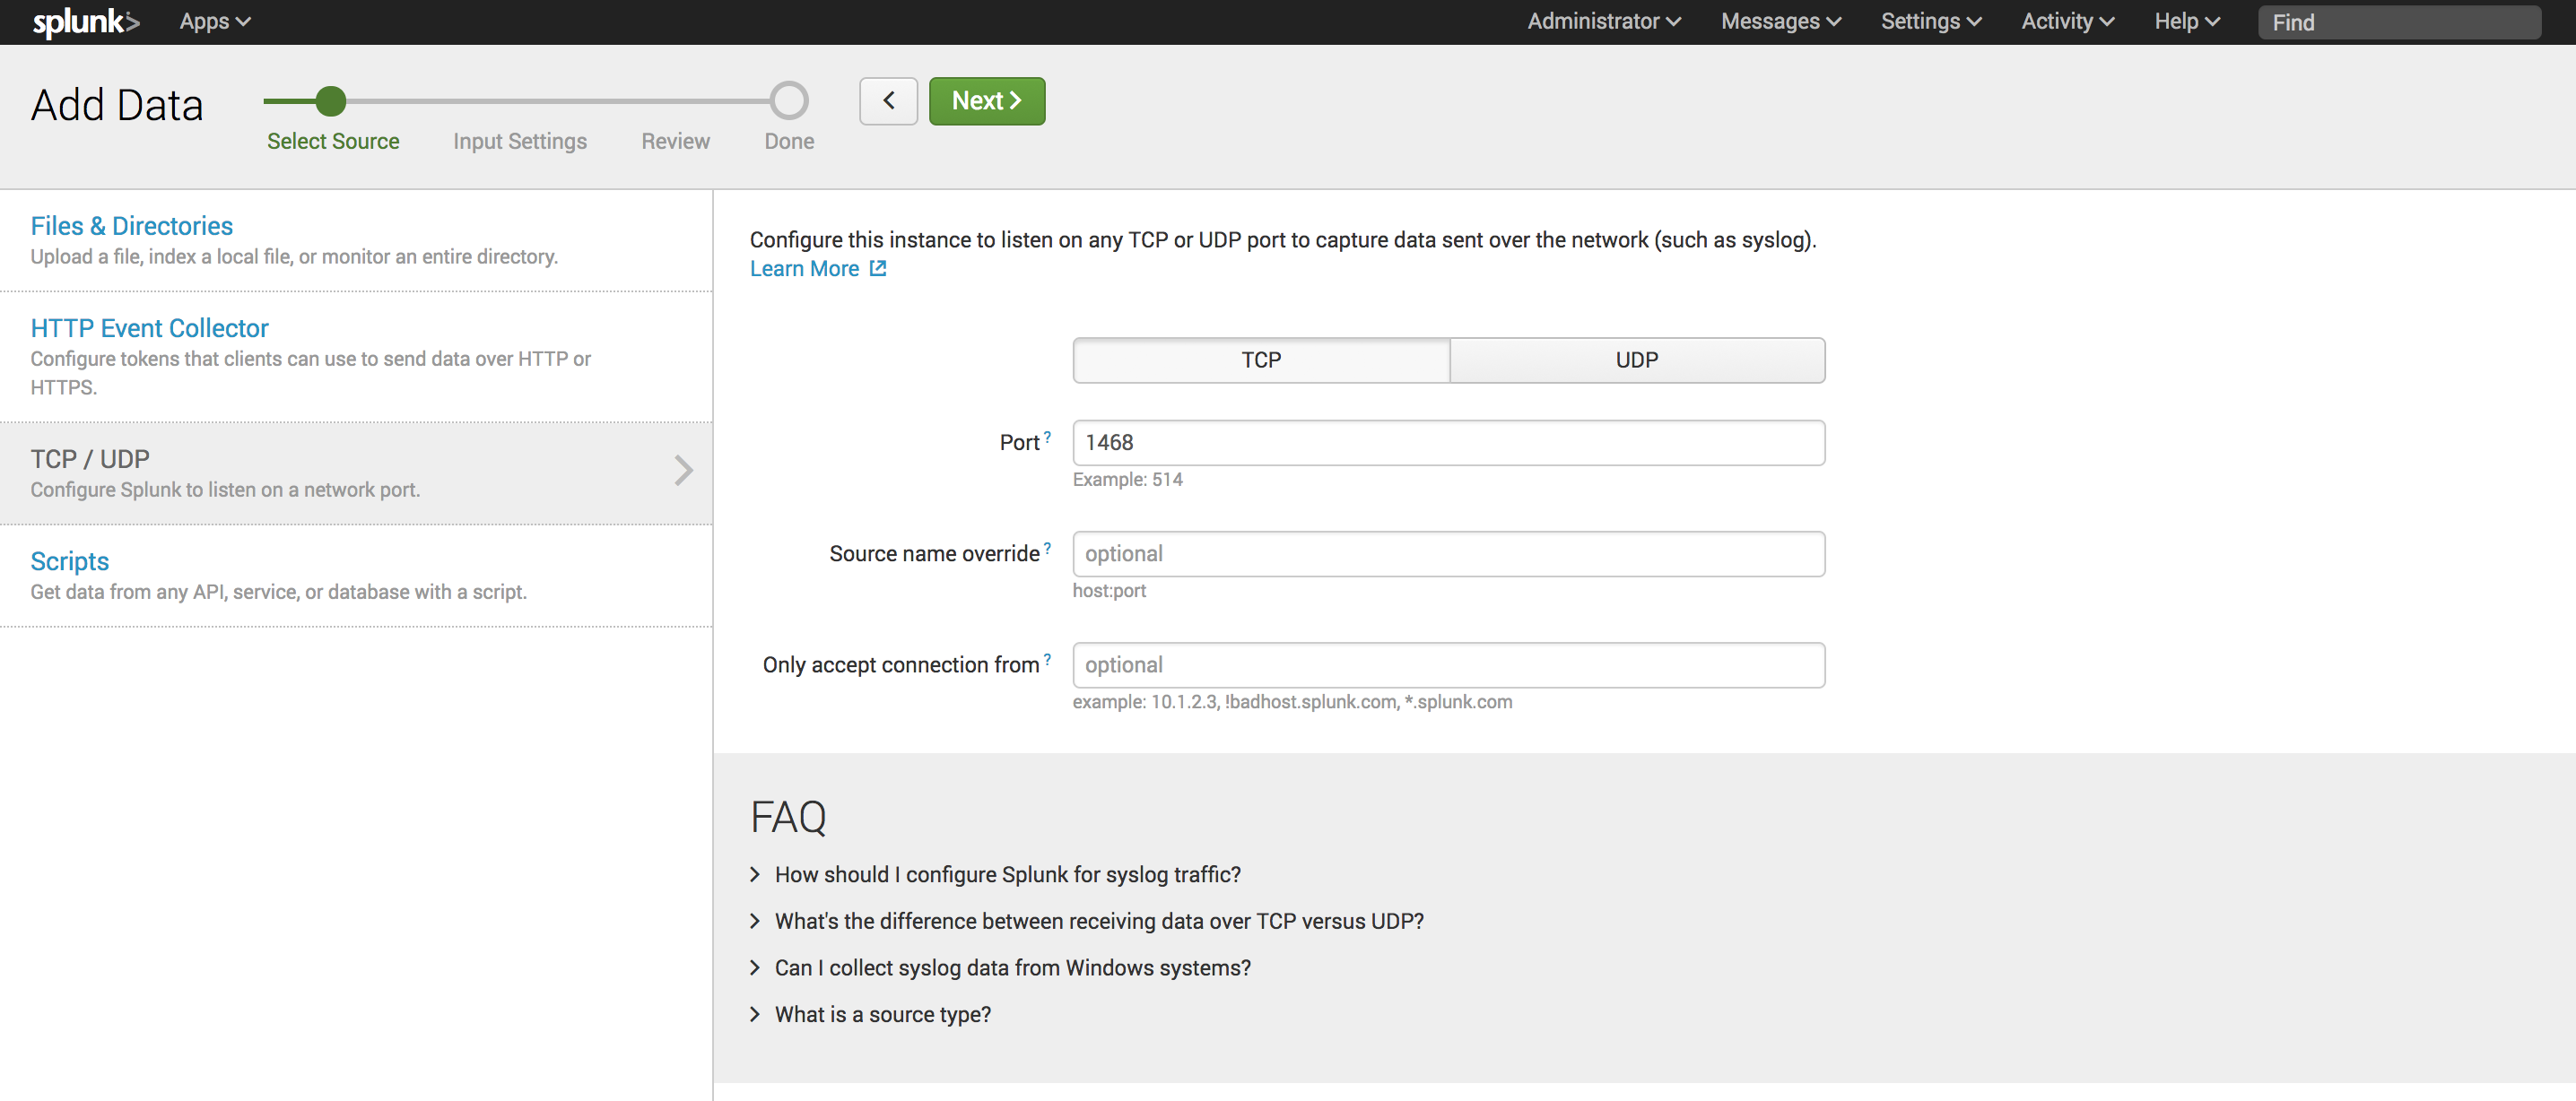
11. Select TCP and input Port: 1468. Click Next 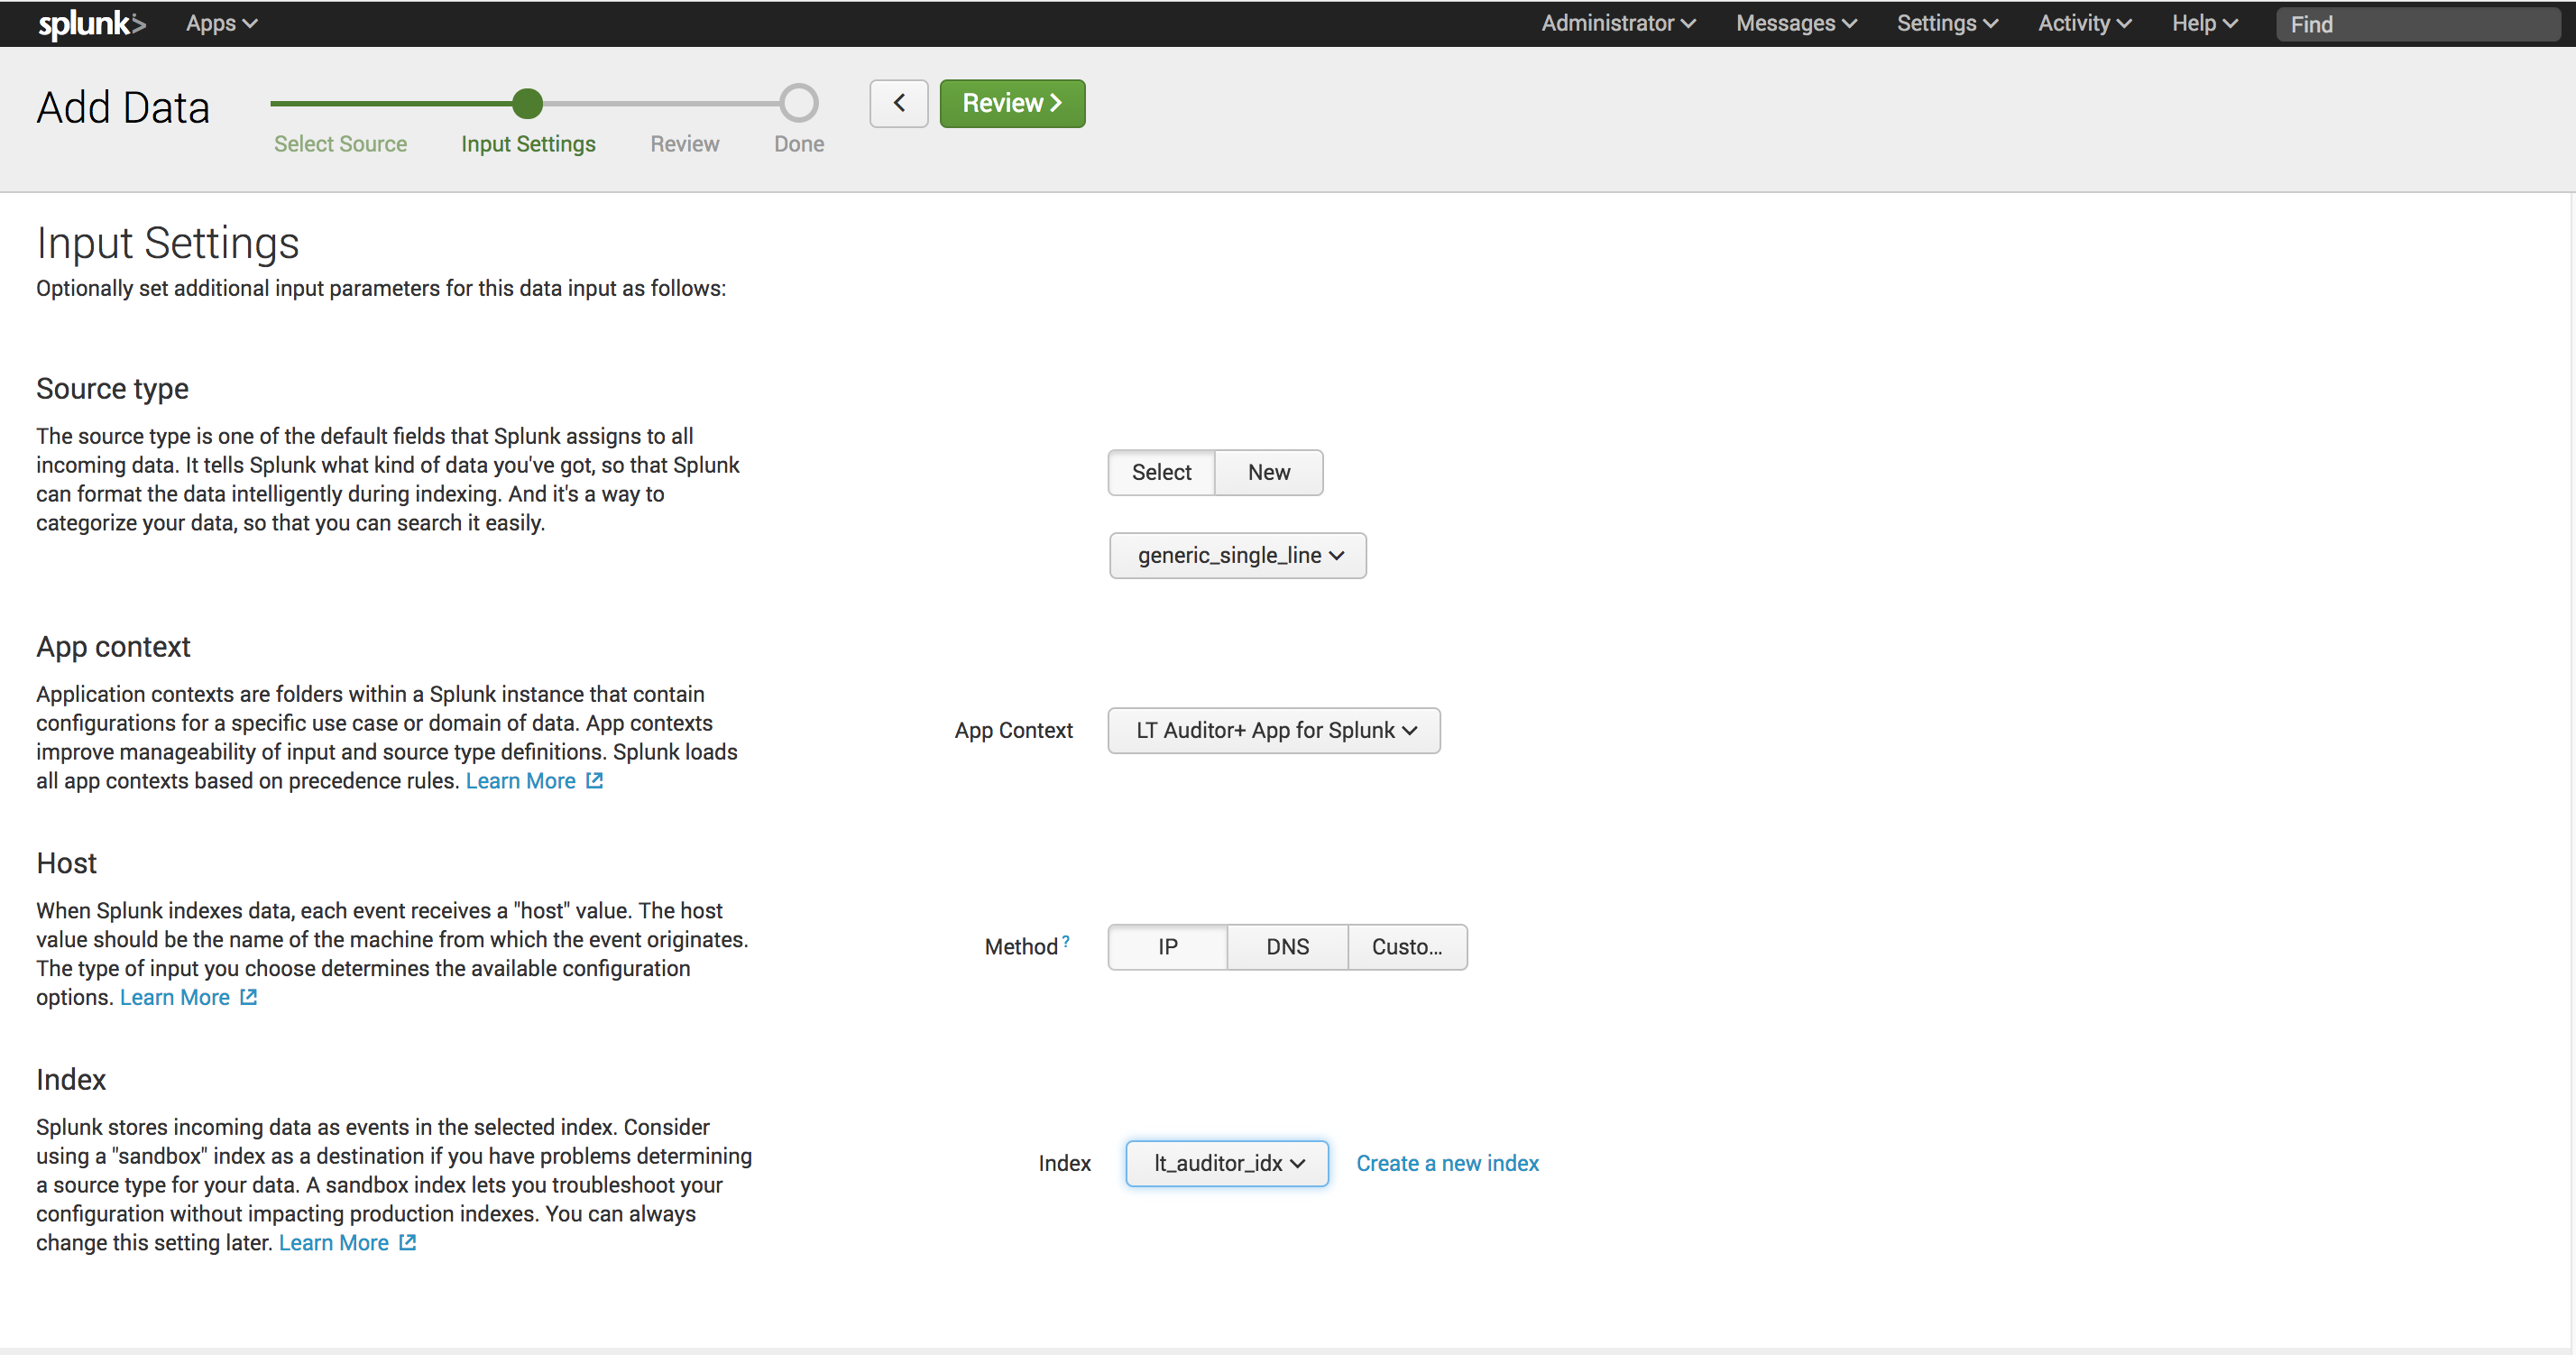
- For Source type select Miscellaneous->generic_single_line
- For App context select LT Auditor+ App for Splunk
- For Host select IP
- For Index select lt_auditor_idx
- Click Review
12. Confirm settings and click Submit to complete.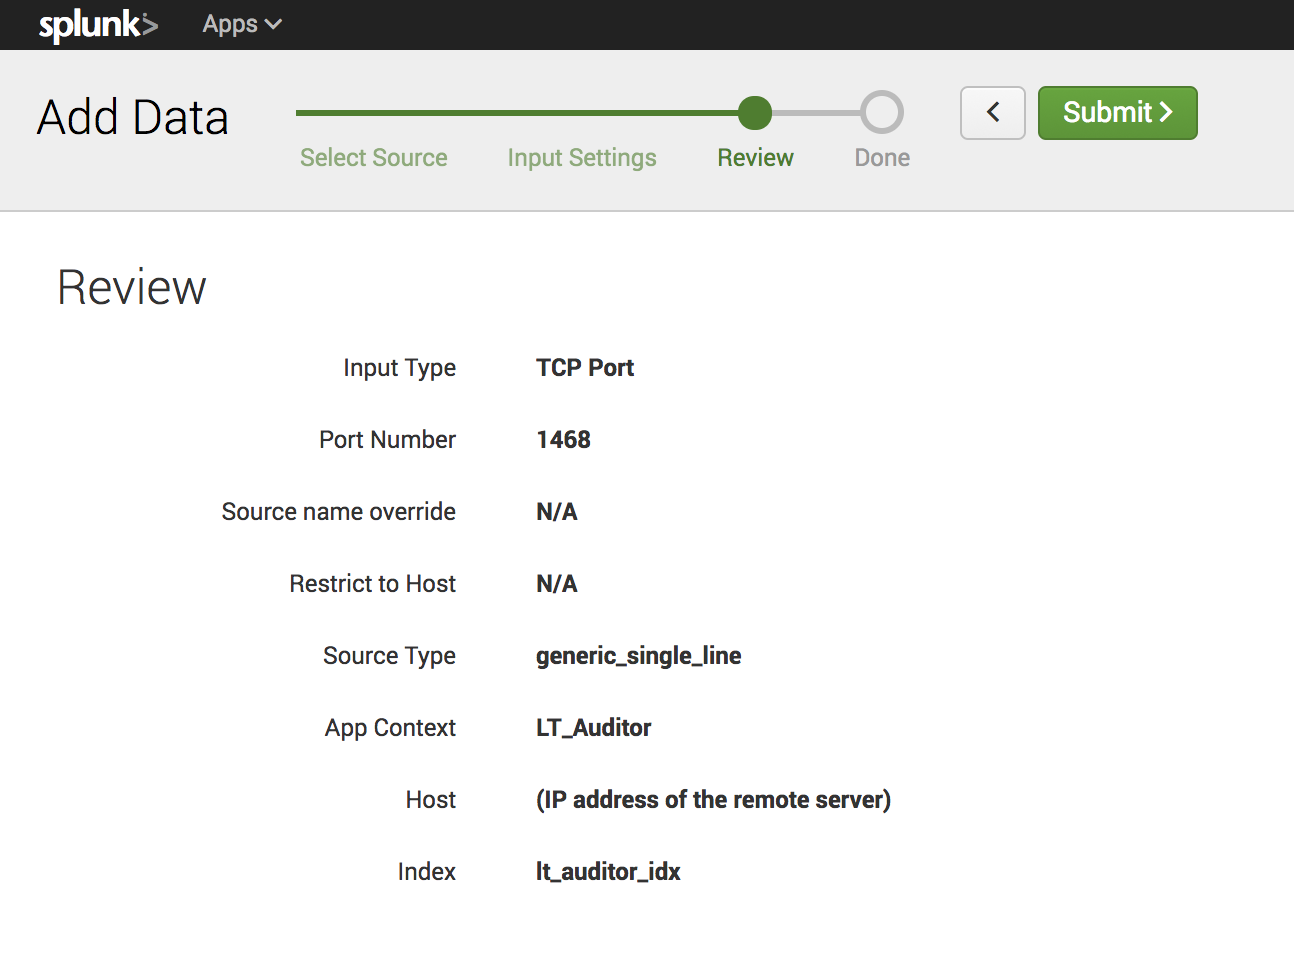
13. Click Settings->Server controls and Restart Splunk
3.2.Distributed Instance Installation
3.2.1.Deploy LT Auditor+ App for Splunk Add-on to Peer Nodes
- Connect to the master-node;
- Extract the contents of the file ‘Distributed Environment/ta-lt-auditor.tar.gz’ to the folder ‘/opt/splunk/etc/master-apps’;
- Run the command /opt/splunk/bin/splunk apply cluster-bundle to deploy to all peer nodes.
The LT Auditor+ Add-on uses a custom index called lt_auditor_idx. Please take steps to ensure that this index is replicated across all peer servers.
3.2.2.Deploy LT Auditor+ App to Search Heads
- Connect to Search Head machine
- For non-clustered Search Head extract the contents of the file ‘Distributed Environment\lt-auditor-app-for-splunk.tar.gz’ to the folder ‘ /opt/splunk/etc/apps’;
- For clustered Search Heads:
- Extract the contents of the file ‘Distributed Environment\lt-auditor-app-for-splunk.tar.gz’ to the folder ‘ /opt/splunk/etc/shcluster/apps’
- Delete file from transforms.conf andprops.conf from the default folder
- Run the command /opt/splunk/bin/splunk apply shcluster-bundle -target https://<master-node>:8089 -force true
3.2.3.Deploy LT Auditor+ Add-on to Heavy Forwarder:
- Connect to Heavy Forwarder machine
- Extract the contents of the file ‘Distributed Environment/ta-lt-auditor.tar.gz’ to the folder ‘/opt/splunk/etc/apps’
- If there are multiple forwarders use a deployer to distribute the Add-on ta-lt-auditor.tar.gzto all forwarders.
3.3.Configure LT AUDITOR+ to send data toSlunk
Run the LTSIEM.EXE file found in the extracted folder from the LT Auditor+ download.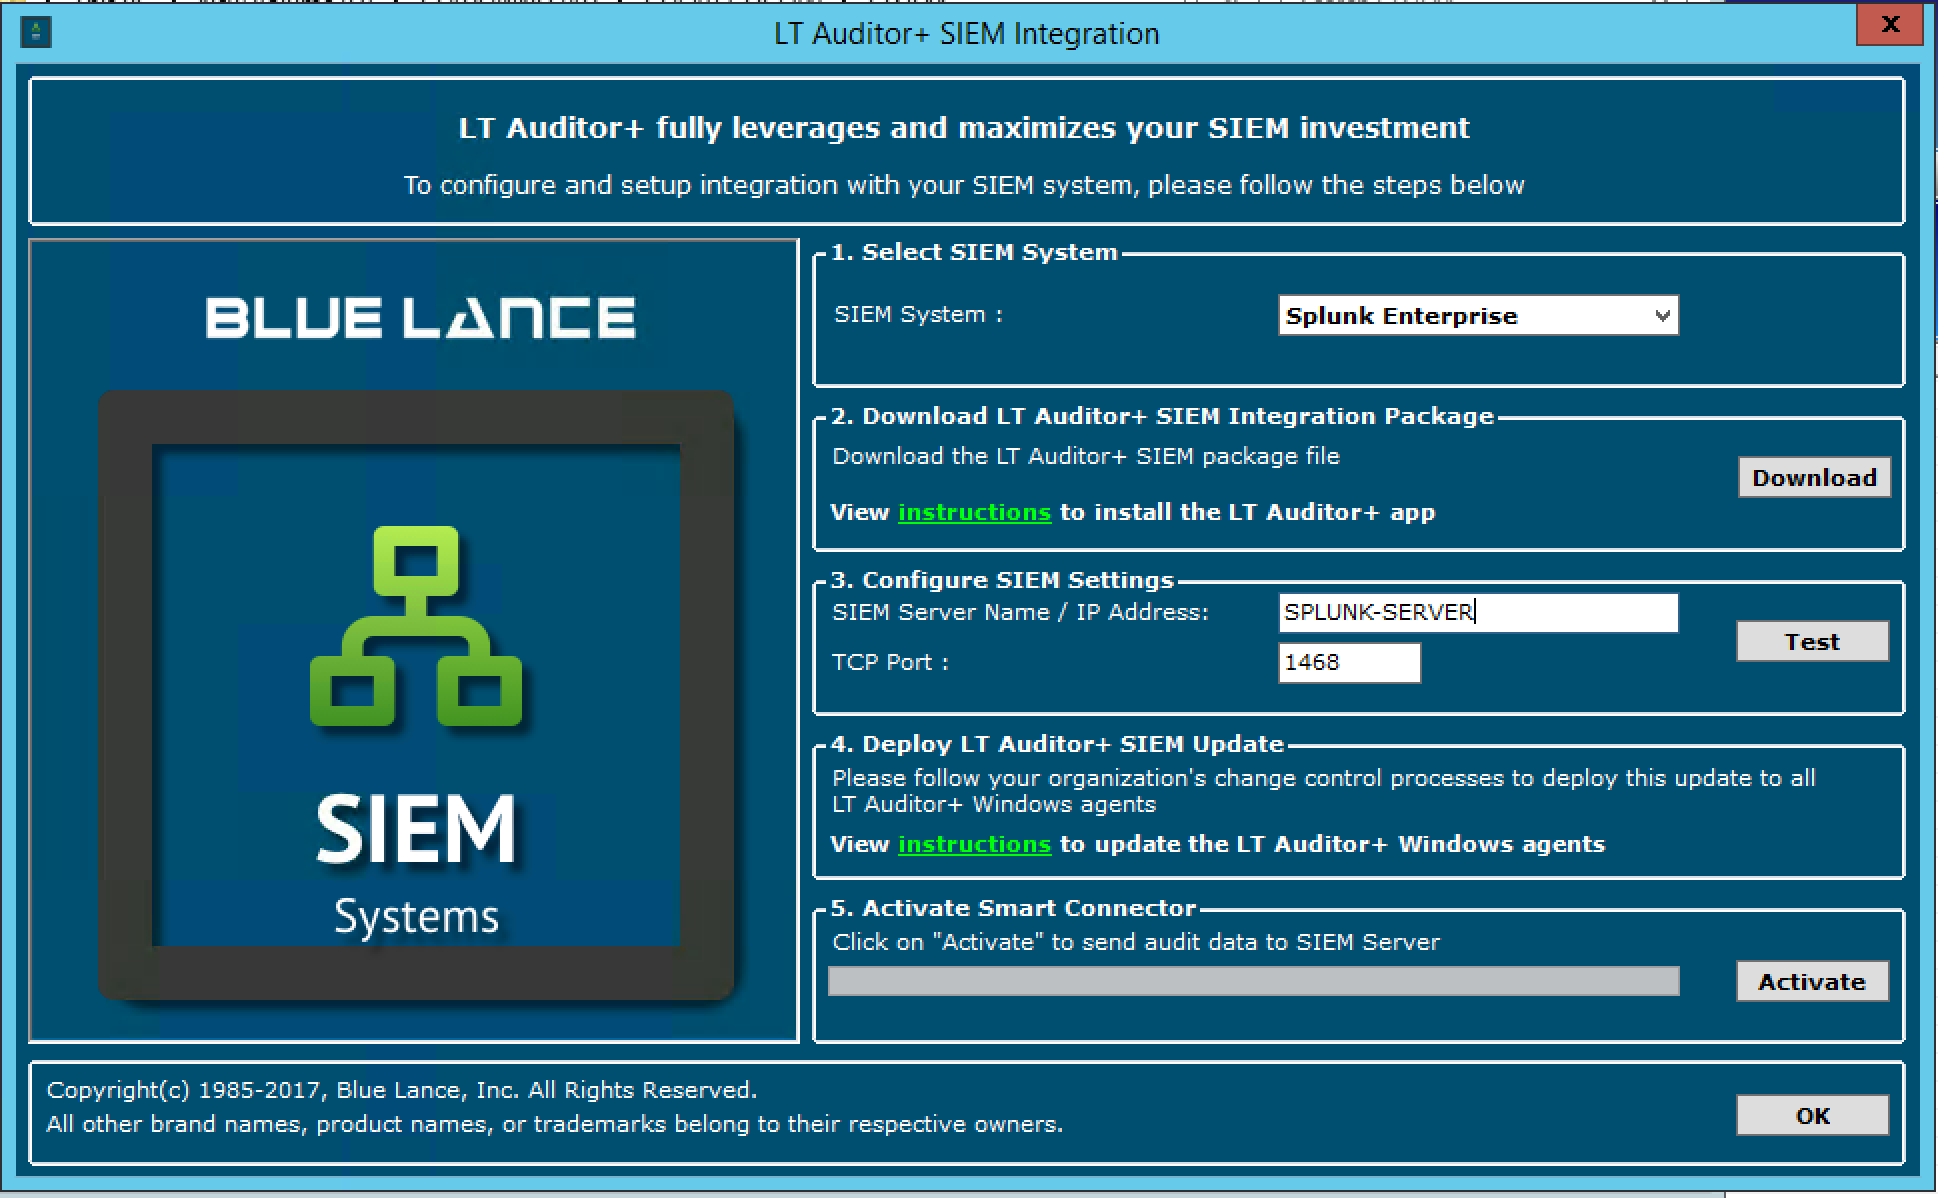
- For SIEM system select Splunk Enterprise
- For SIEM Server Name/IP Address set Name/IP of Splunk Server
- For TCP Port set 1468
- Click Activate to configure settings
4.LT Auditor+ App for Splunk
The LT Auditor+ App for Splunk provides a portal to view audit data ingested from LT Auditor+ and has the following dashboards
| Activity | Suspicious Activity | Best Practices |
| Active Directory | Identify bulk rename operations | Elevated Privileges |
| Files/Folders | Track copying of large number of files | System Access |
| Group Policy | Monitor excessive failed logins | Policy Changes
|
| Logon Server | Review account lockout activity
|
|
| Health Check |
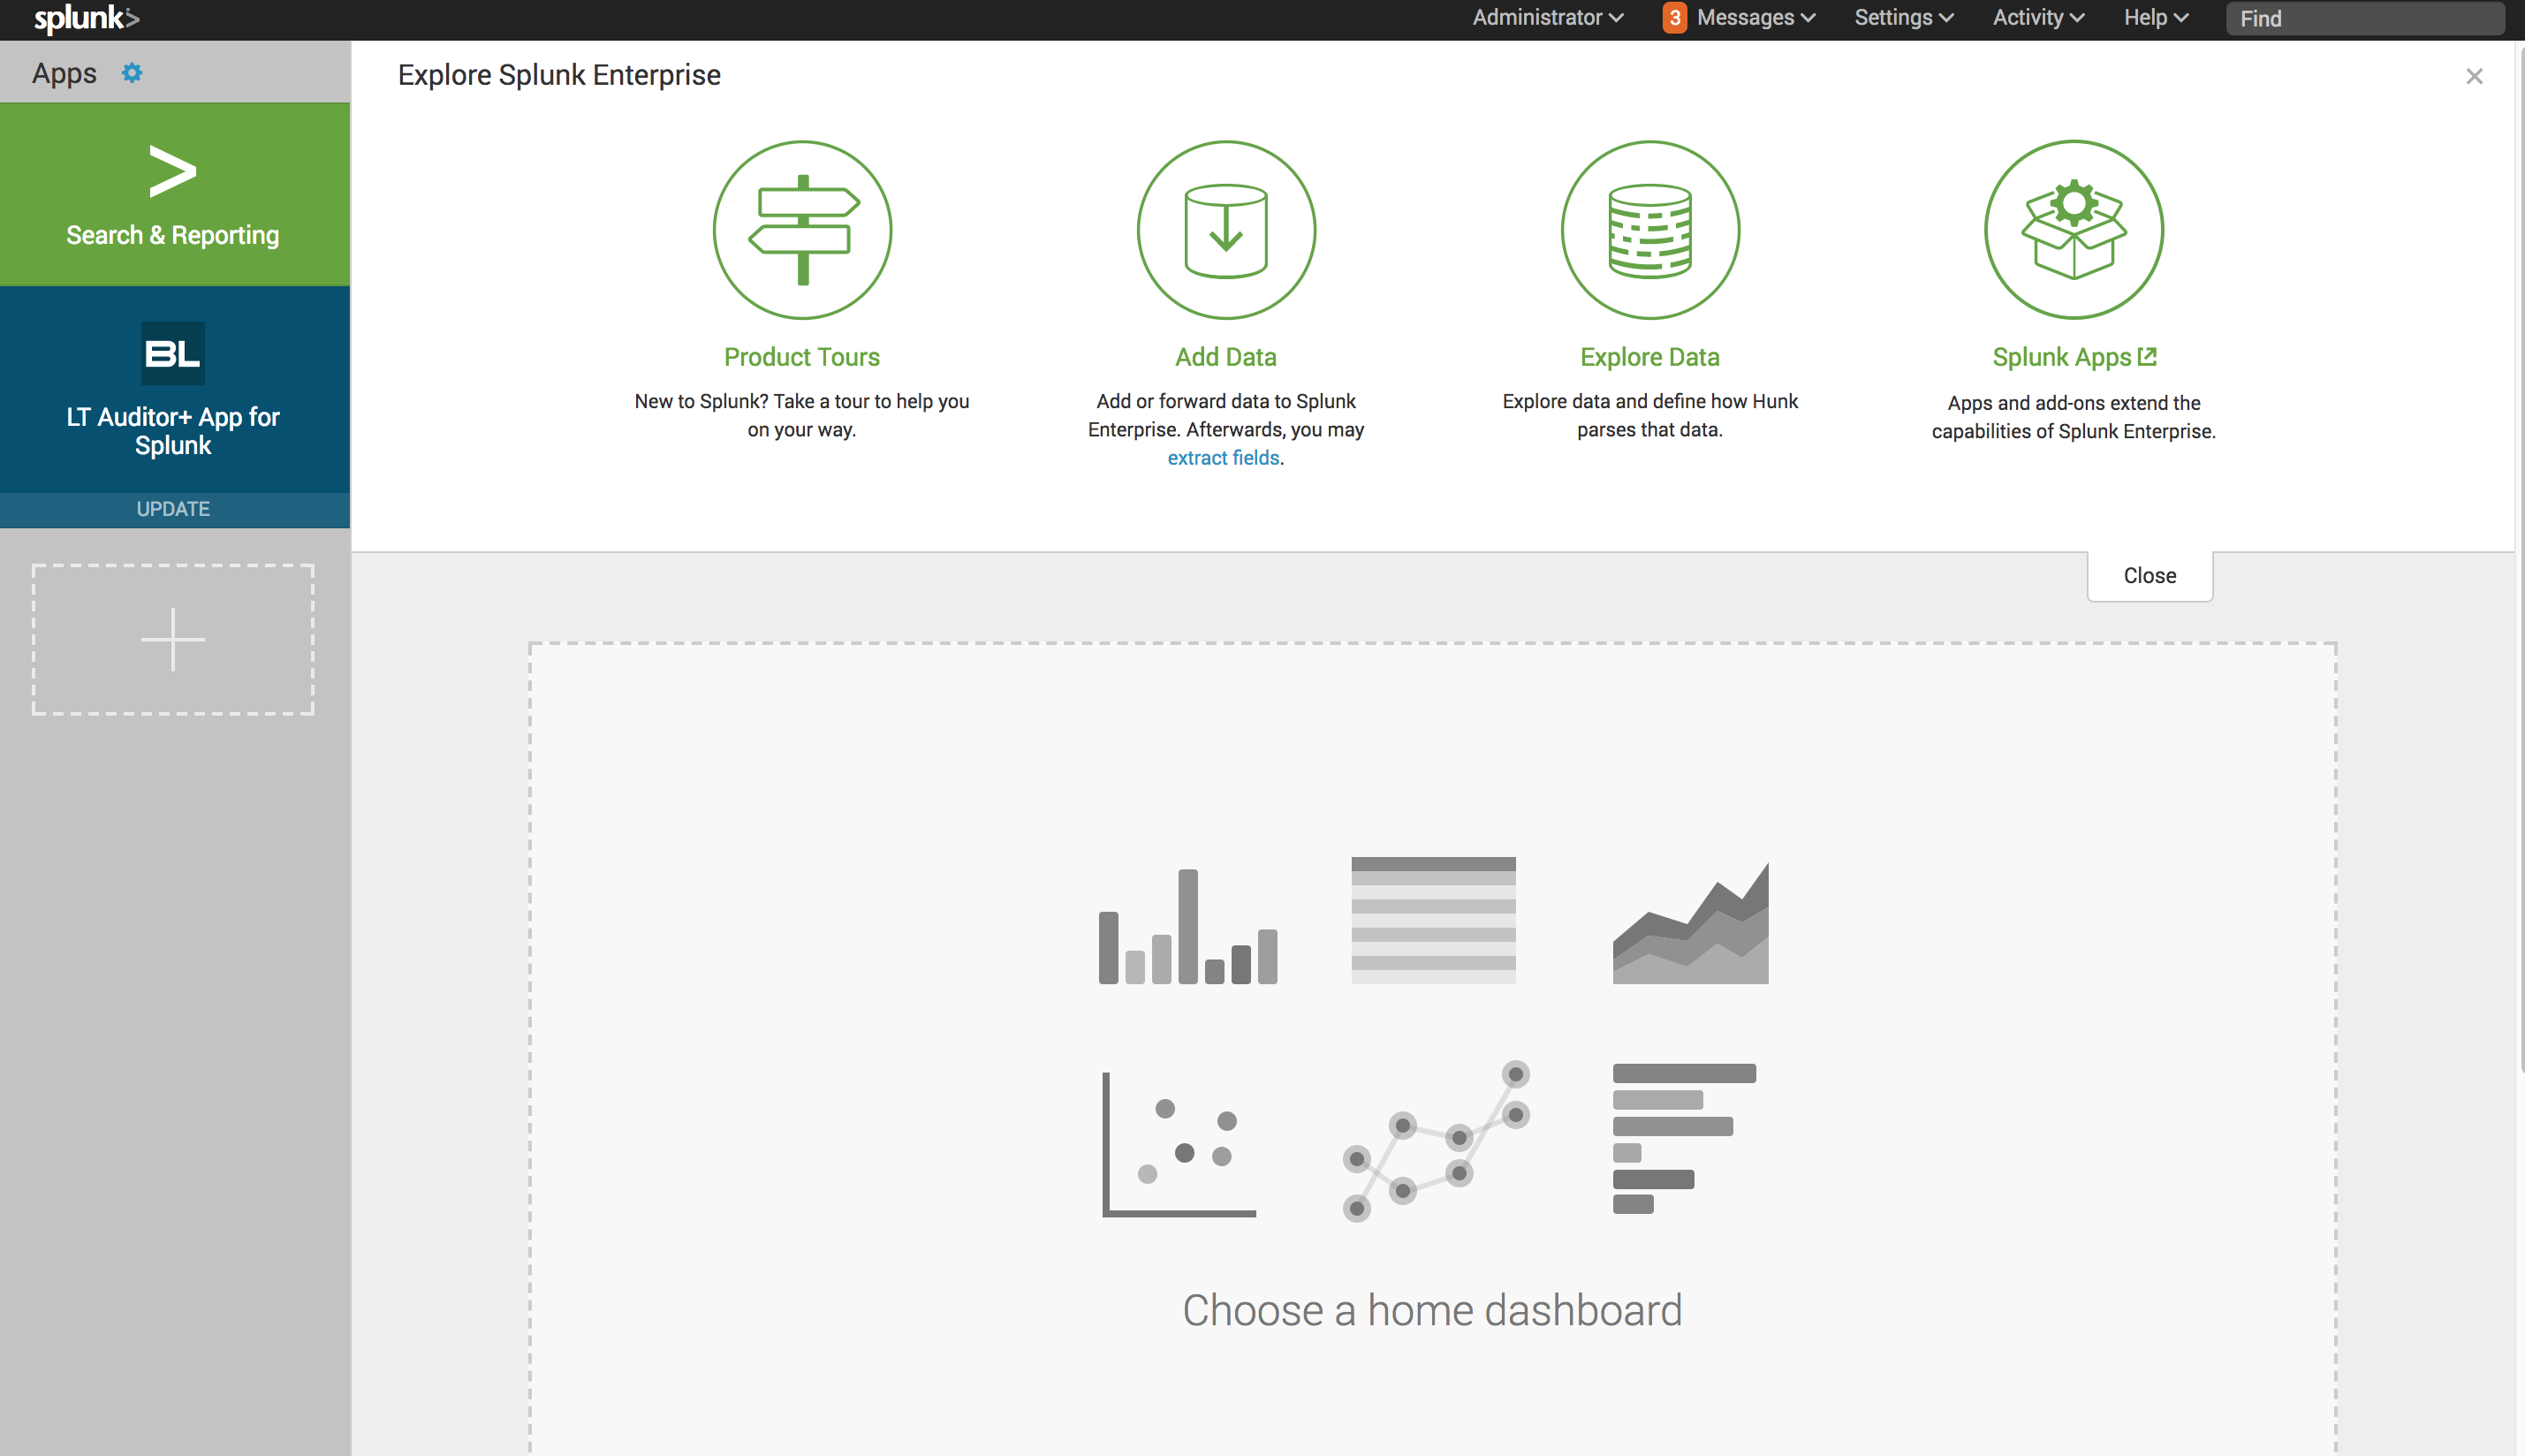
After the App is installed, users will be gain access to the portal by clicking on the LT Auditor+ App for Splunk as shown below.
The first dashboard is the Home dashboard that provides a summary of all LT Auditor+ activity ingested by Splunk.
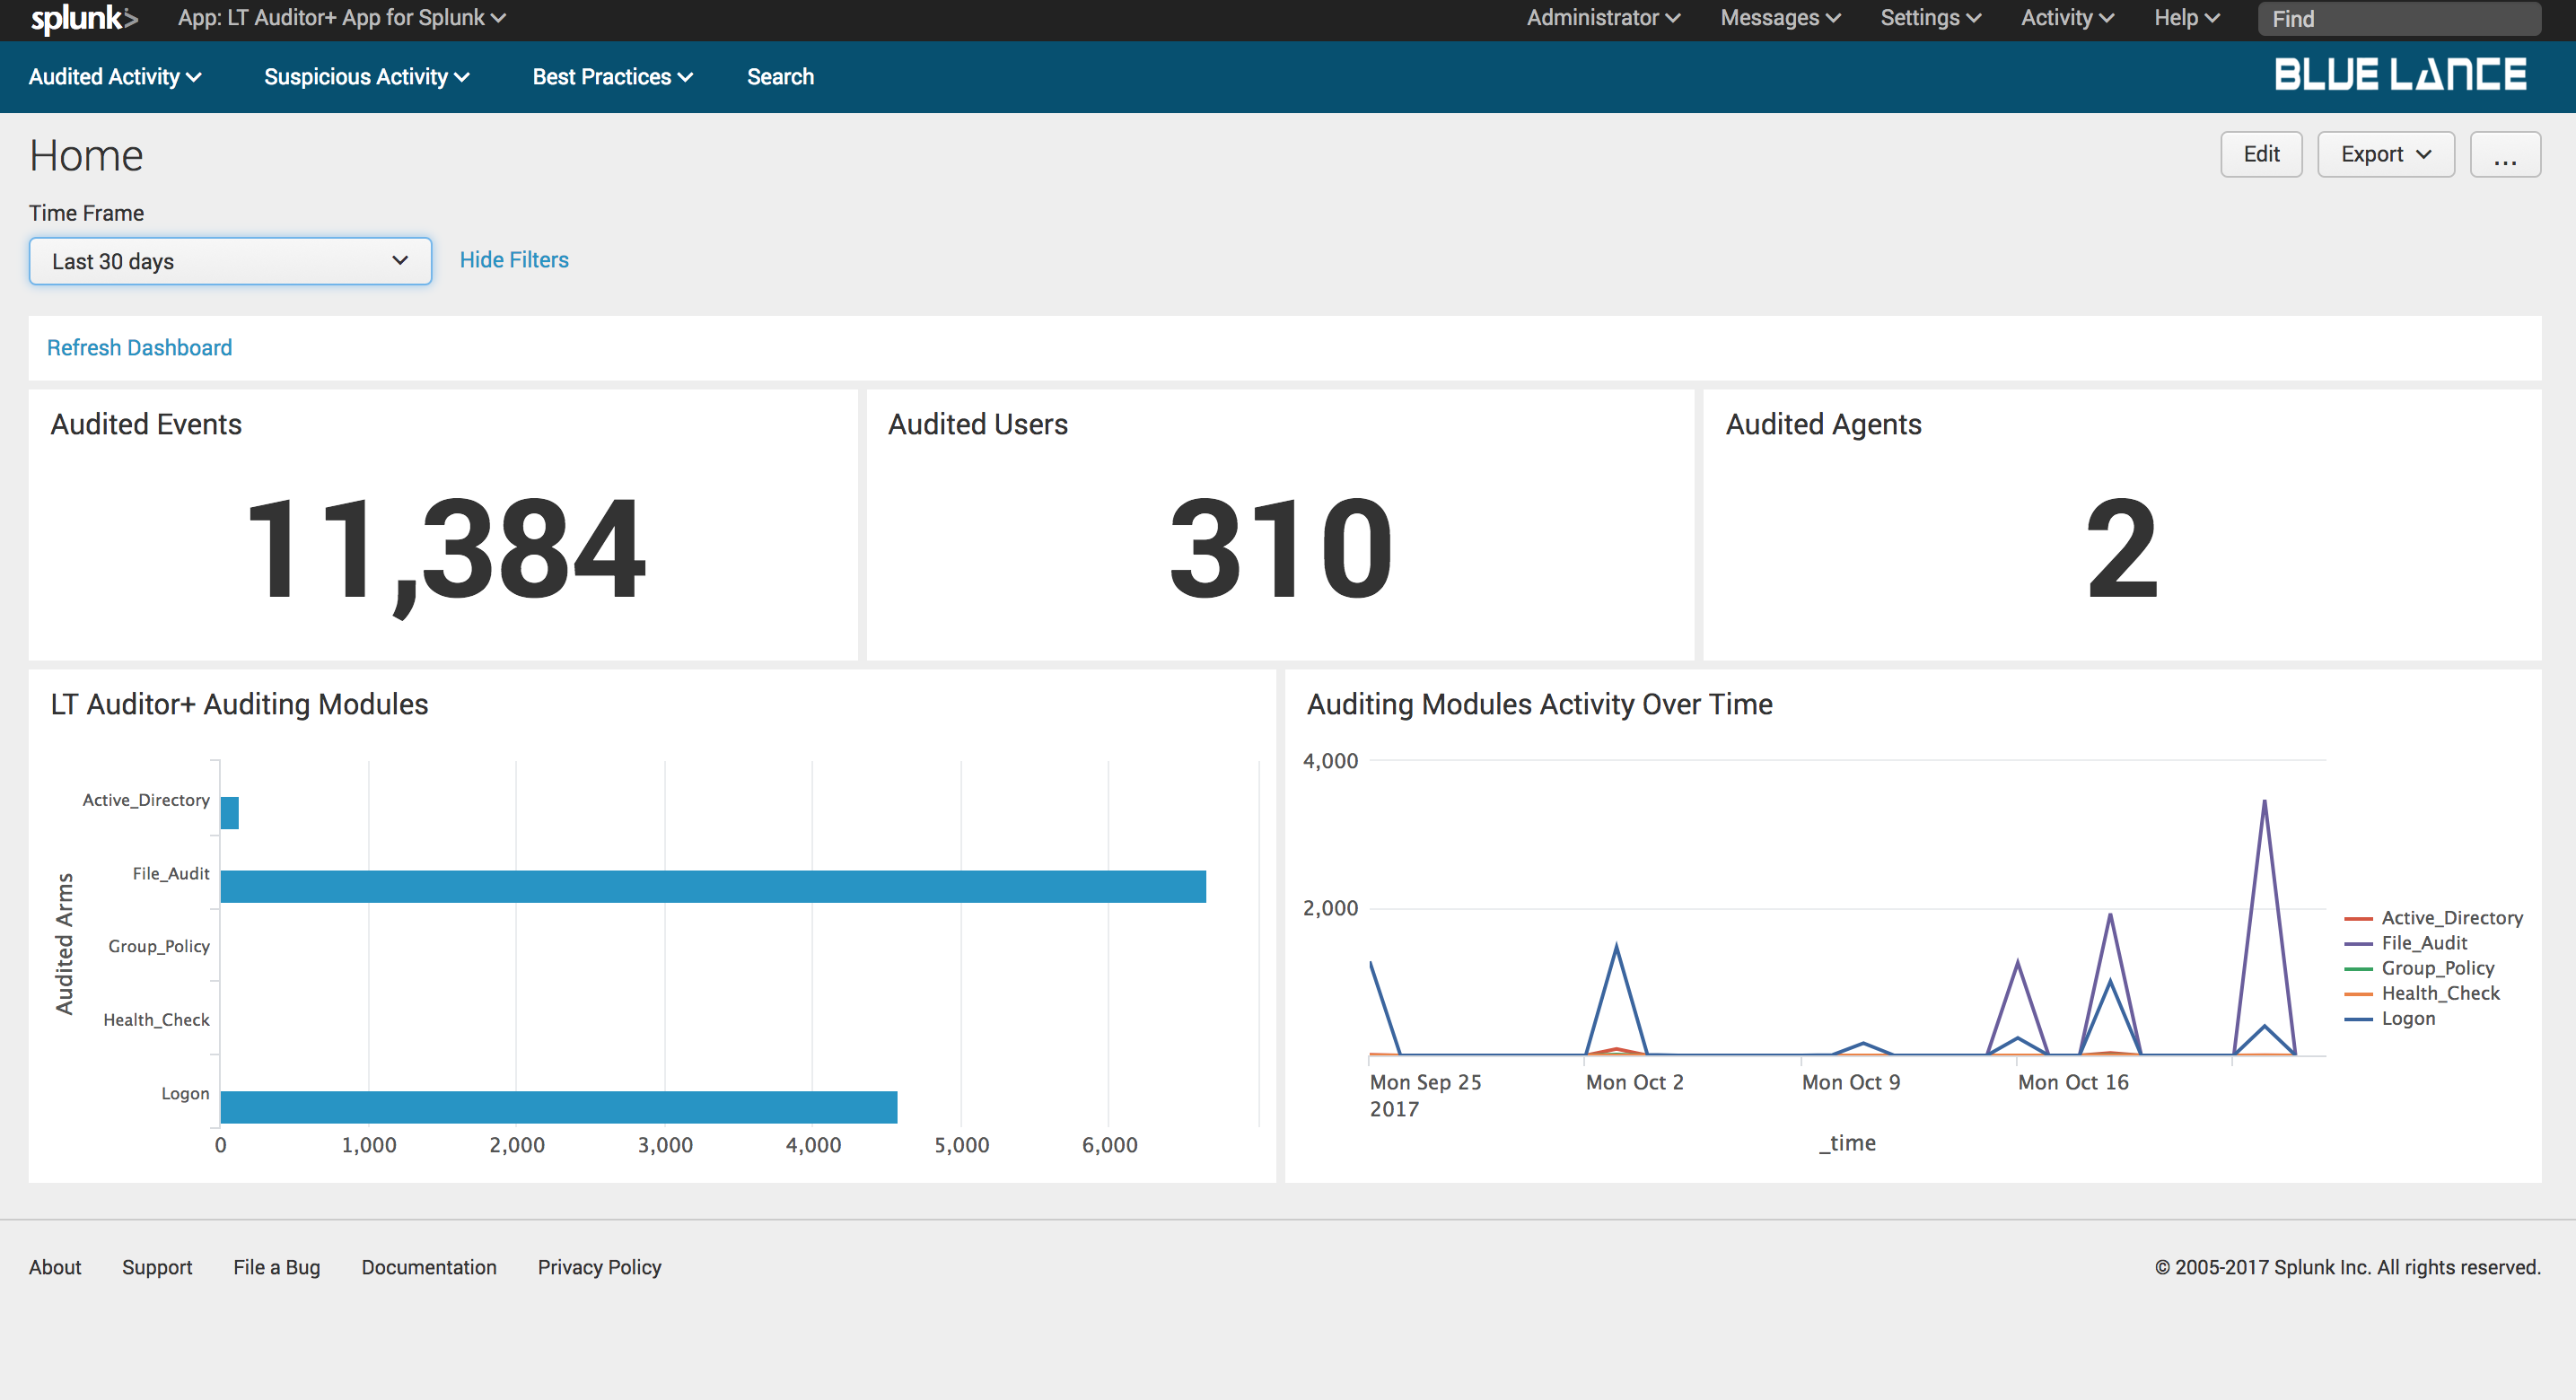
The home dashboard displays the following notables:
- Audited Events – Count of total audited events for specified time range.
- Audited Users – Count of total users audited for specified time range.
- Audited Agents – Number of LT Auditor+ agents sending data to Splunk.
Clicking on any of the LT Auditor+ Audited Modules listed will take the user to new dashboard for specified activity. The following dashboards are accessible:
- Active Directory
- File/Folder
- Group Policy
- Logon
- Health Check
5.Active Directory Dashboard
The Active Directory dashboard provides complete details of all Active Directory activity recorded with LT Auditor+ as shown.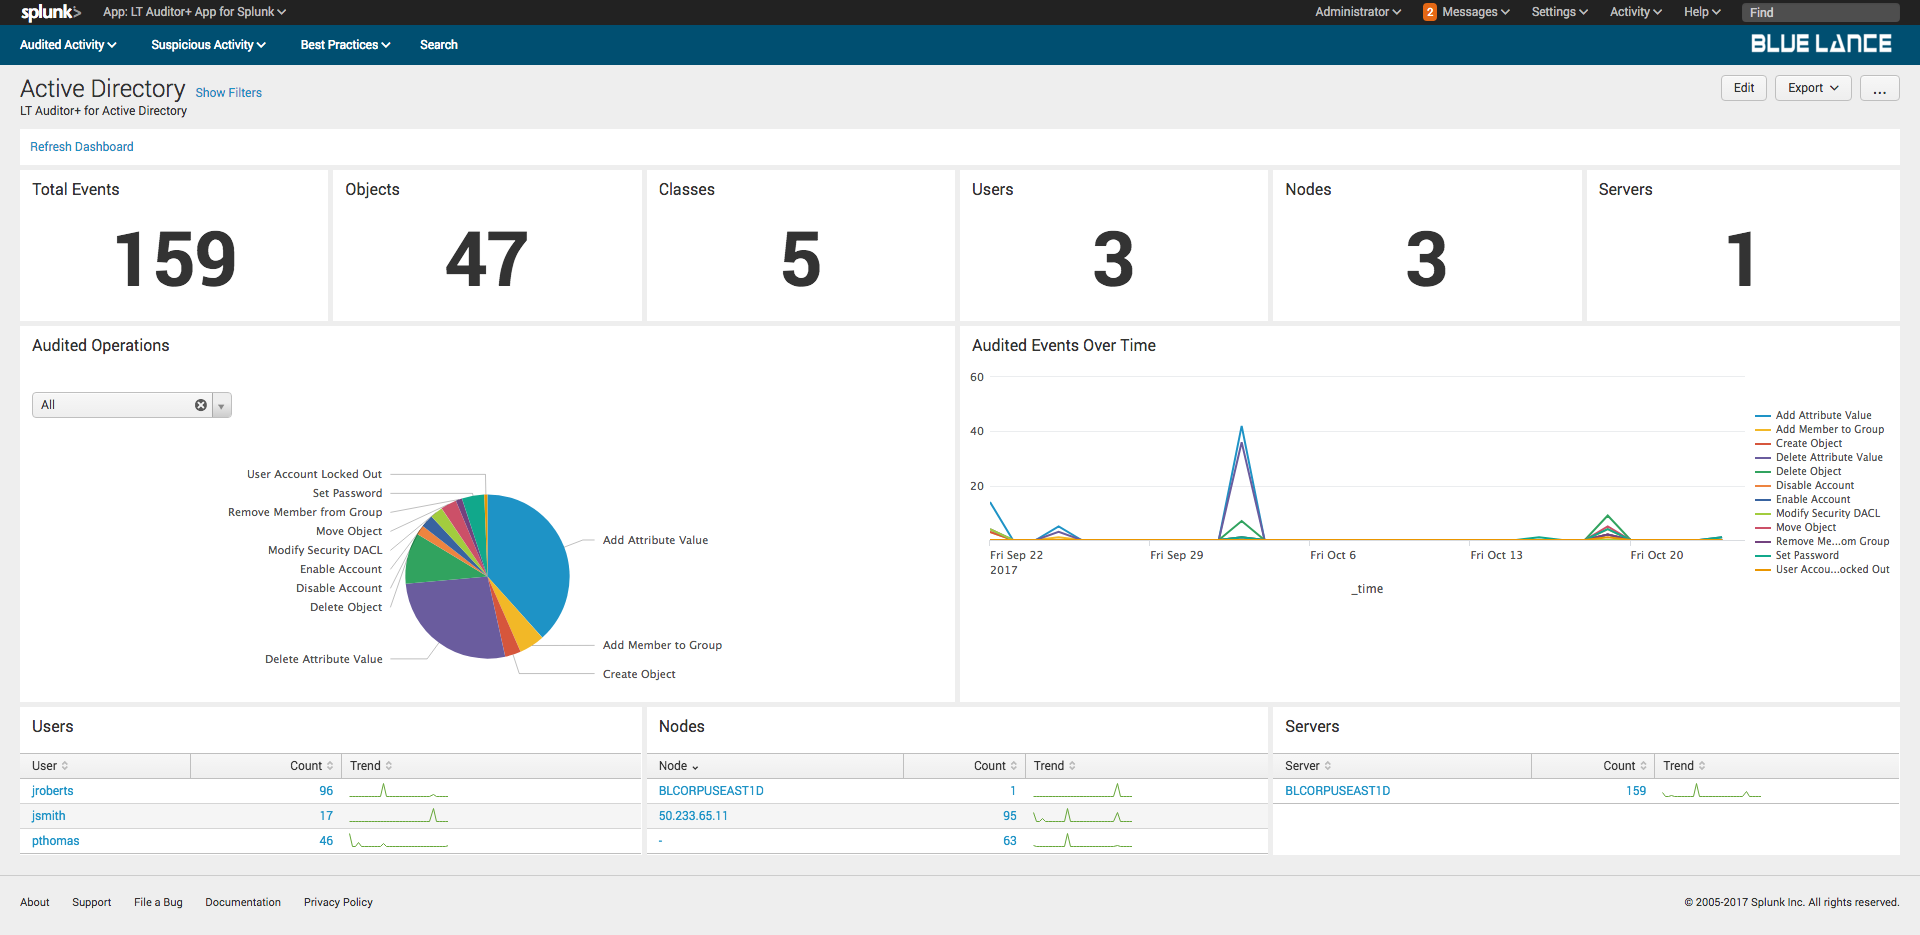
The dashboard has the following sections:
- Filters – Criteria can set to define content displayed on the dashboard;
- Notables – Summary of information about all activity that occurred;
- Audited Operations – Pie chart of specific operations for given filter criteria;
- Audited Events Over Time – Graphical representation of event modifications occurred for specified filter criteria;
- Users – List of all users making changes to cause the events to be recorded;
- Nodes – List of source nodes where changes were made from;
- Server – List of host servers where the changes occurred.
5.1.Filters
Click show filters to display query criteria for the dashboard as shown below. The dashboard will automatically update if criteria is specified in the filters.
Criteria can be configured based on:
- Time Frame
- Active Directory Objects
- Active Directory Classes
- Active Directory Attributes
- Active Directory Attribute Values
- Users
- Nodes
- Servers
Clicking on Audited Operations will produce a detailed report on specified operation. For example, clicking on Delete Object will generate a report all Active Directory objects deleted for specified filter criteria.
Audited Events over time is graphical representation of when Active Directory modifications occurred for specified filter criteria.
5.2.Notables
The following section describe each of the Active Directory notables.
5.2.1.Total Events
Total Events is a count of all Active Directory events collected as per filter criteria. Clicking on this notable will generate a report of those events as shown below.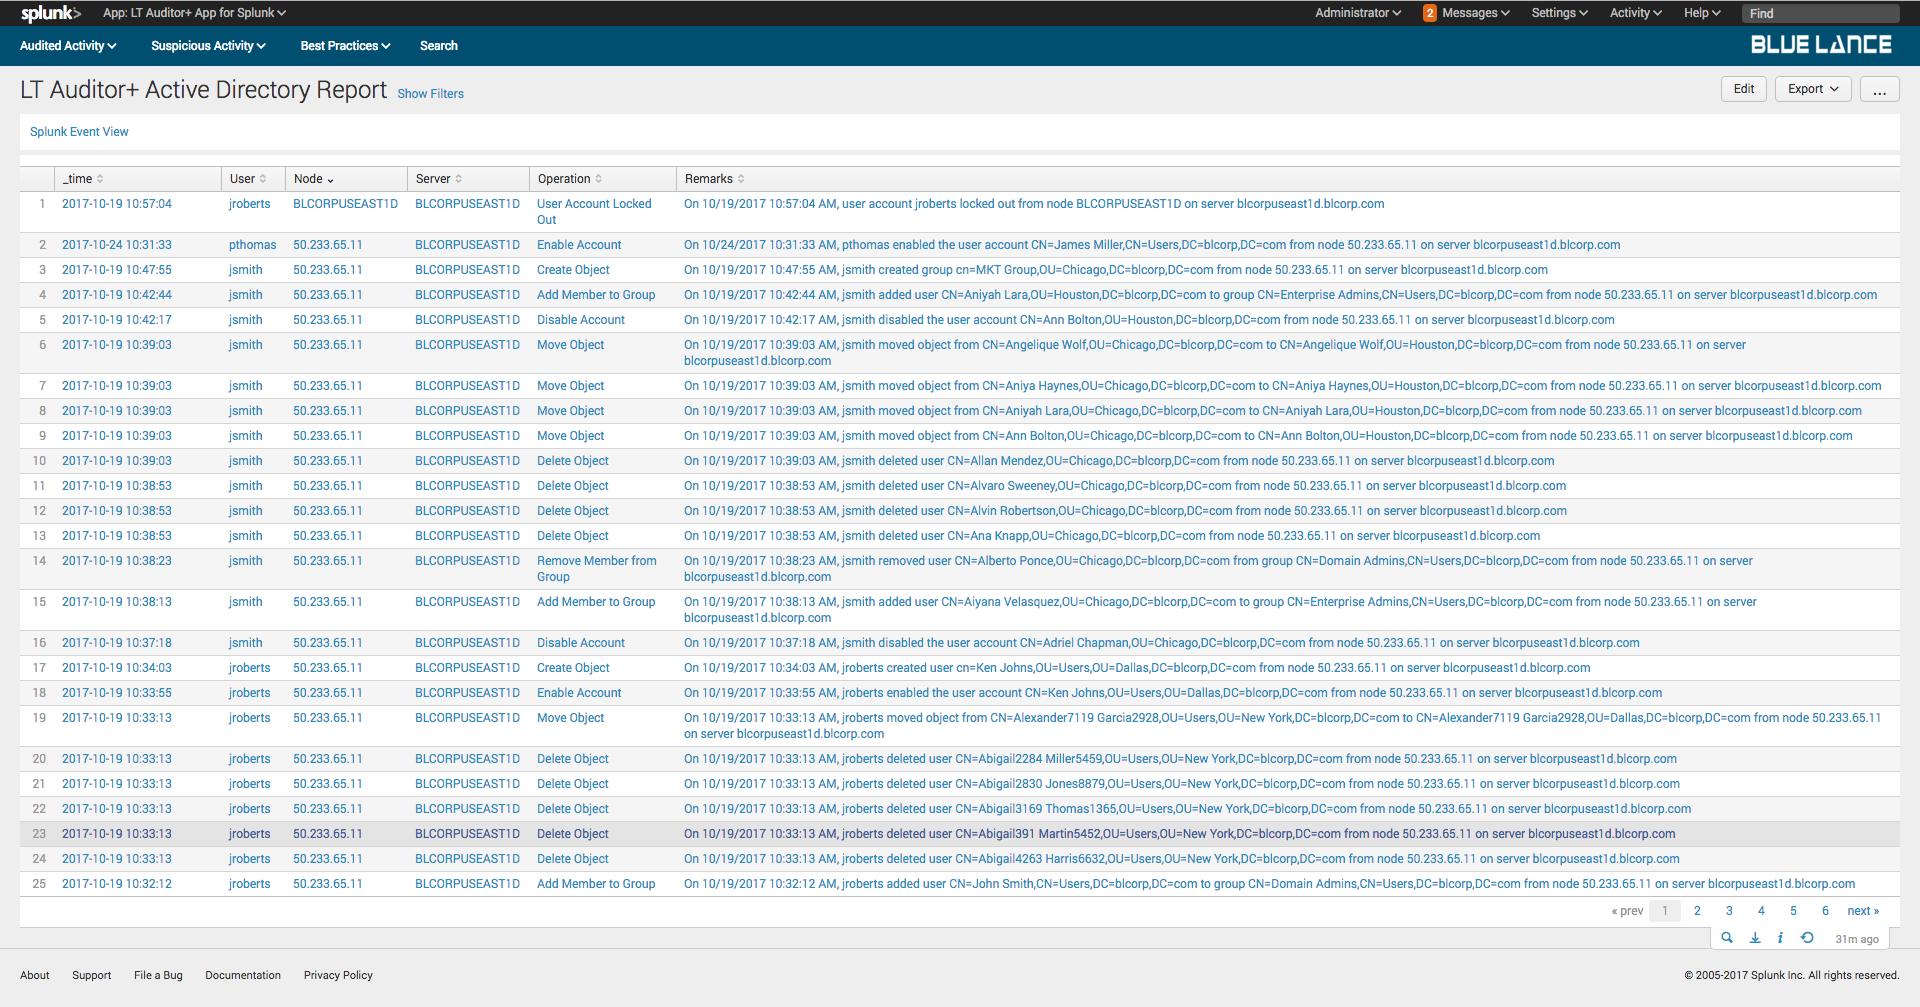
After a report has been generated, it can be further refined be inputting additional filter criteria. All reports can be exported to other file formats.
5.2.2.Objects
Objects is a count of distinct Active Directory objectsmodified per filter criteria. Clicking on this notable generates a table summary of these objectswith column counts of users, nodes, servers and activity count as shown below. Clicking on any of the objects will generate a detailed report of changes on specified object.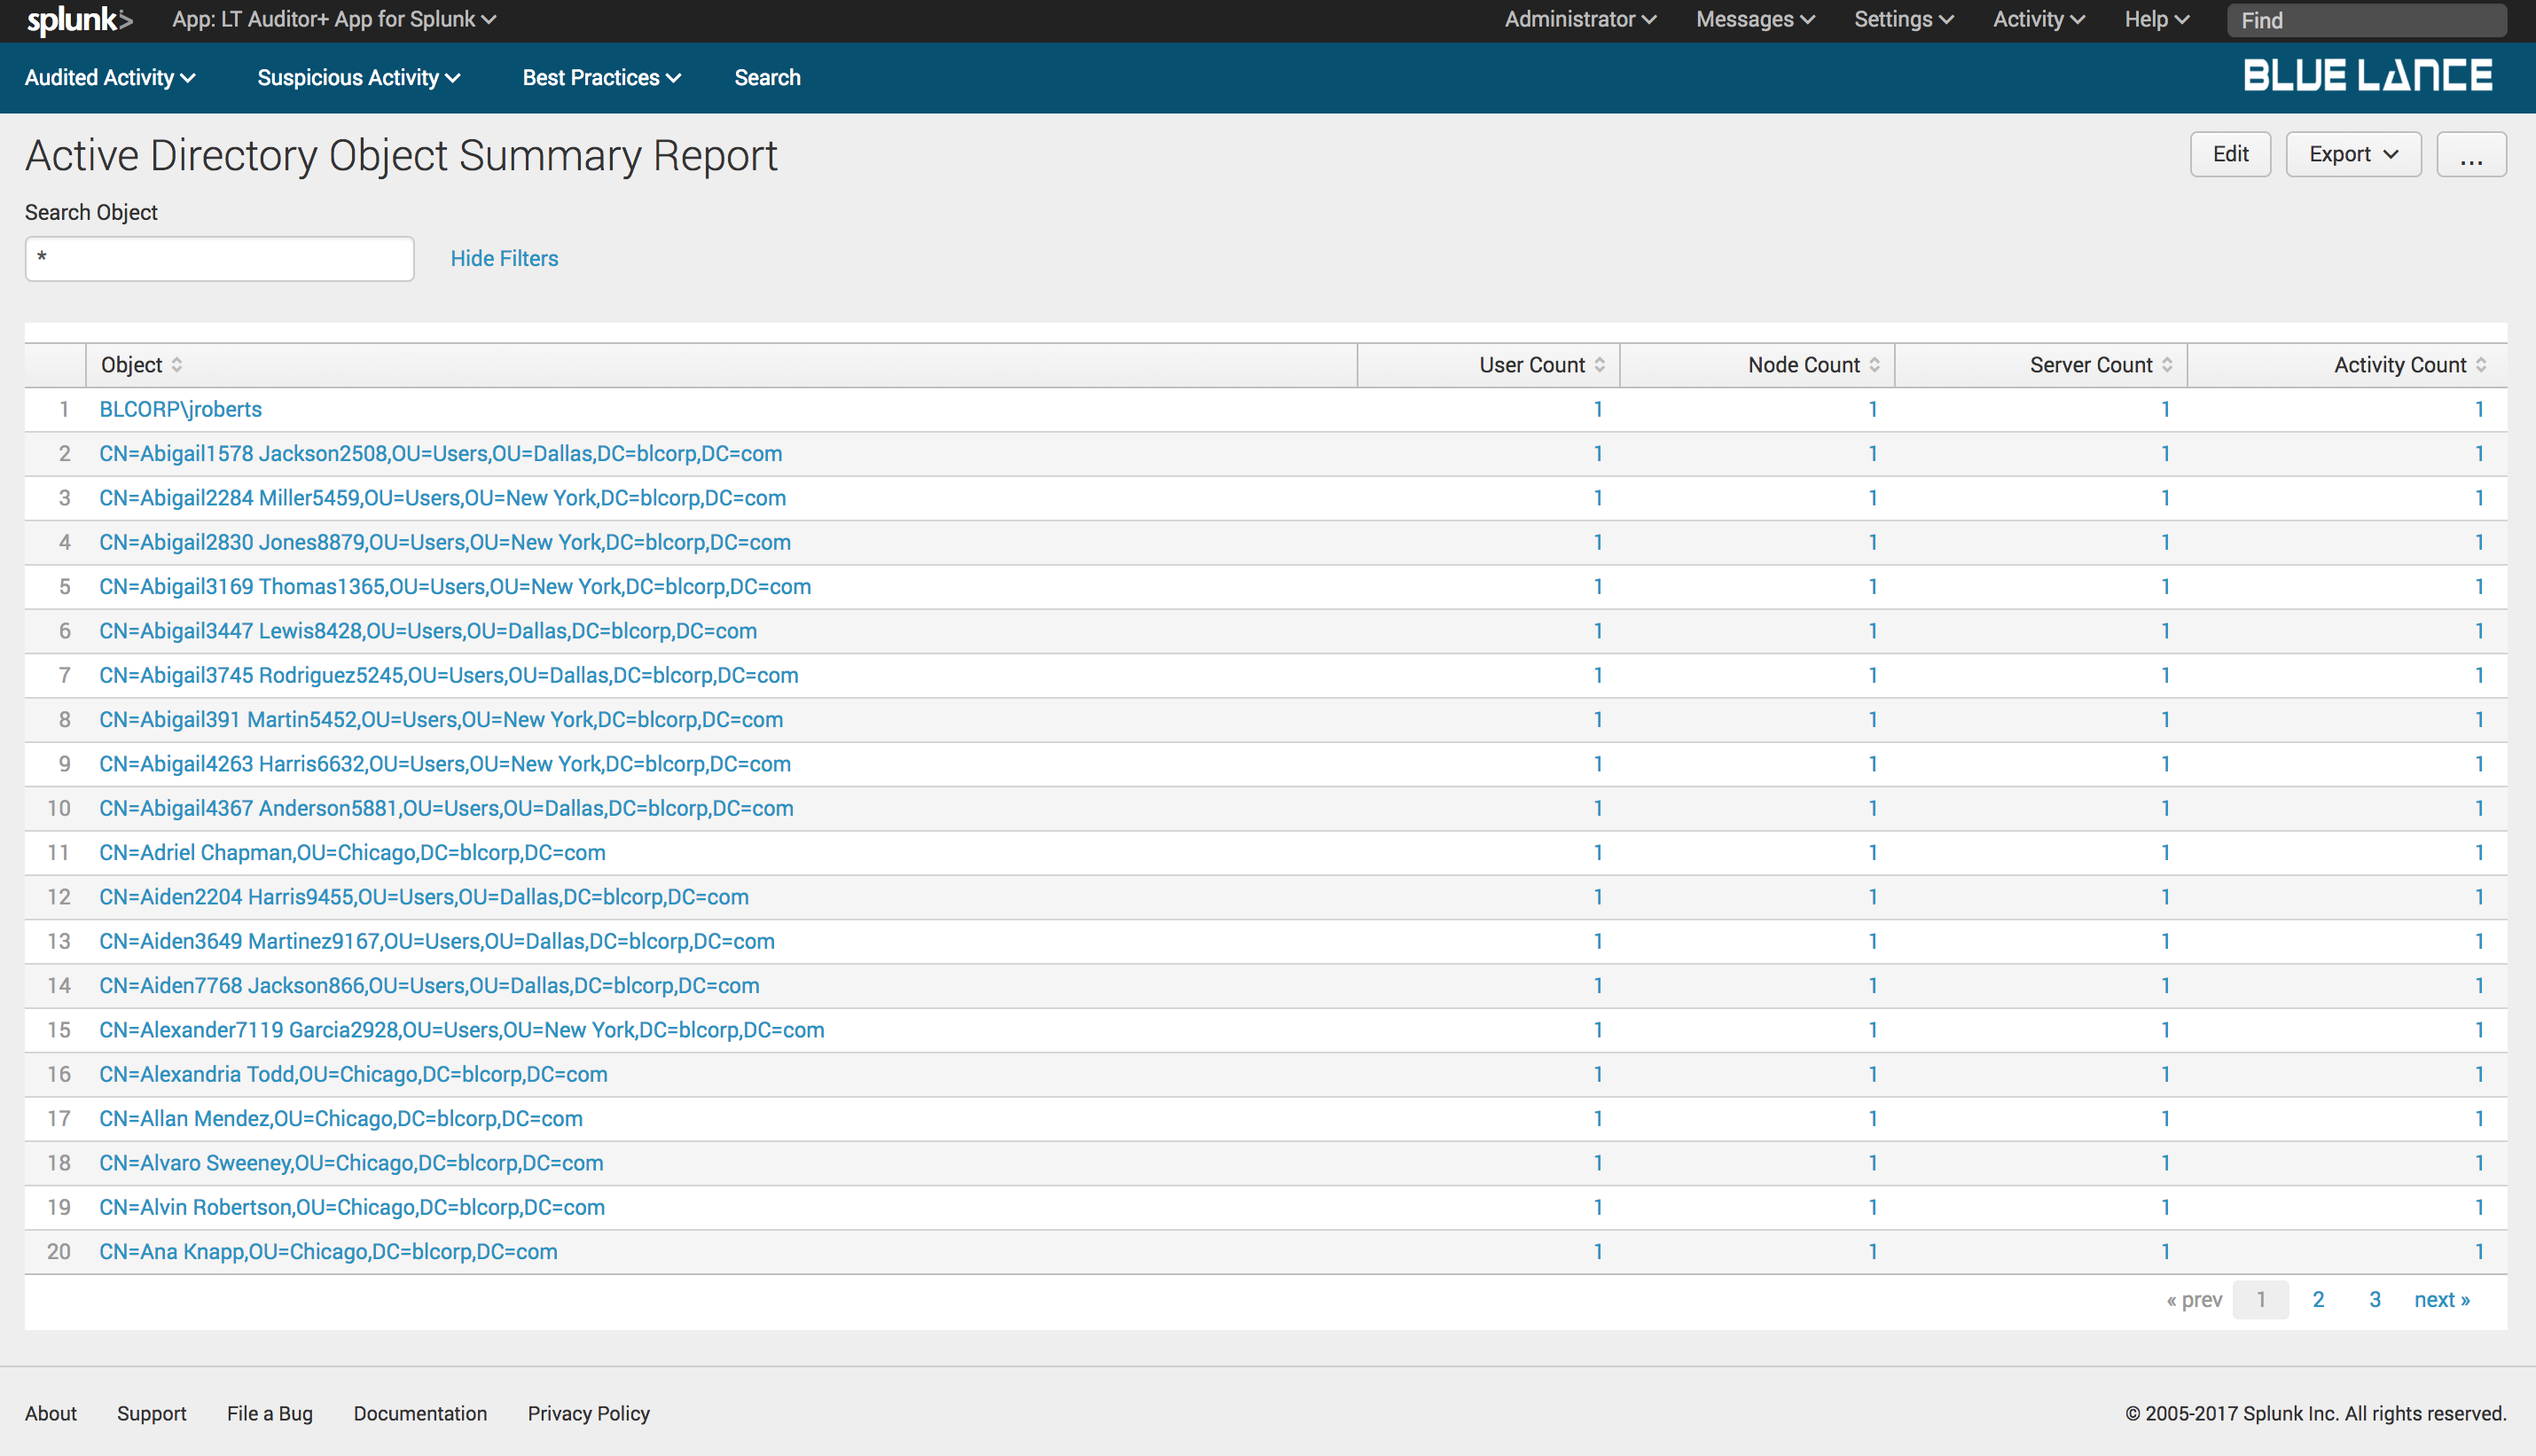
5.2.3.Classes
Classes is a count of distinct Active Directory classes modified per filter criteria. Clicking on this notable generates a table summary of these classes with column counts of users, nodes, servers and activity count as shown below. Clicking on any of the classes will generate a detailed report of changes on specified class.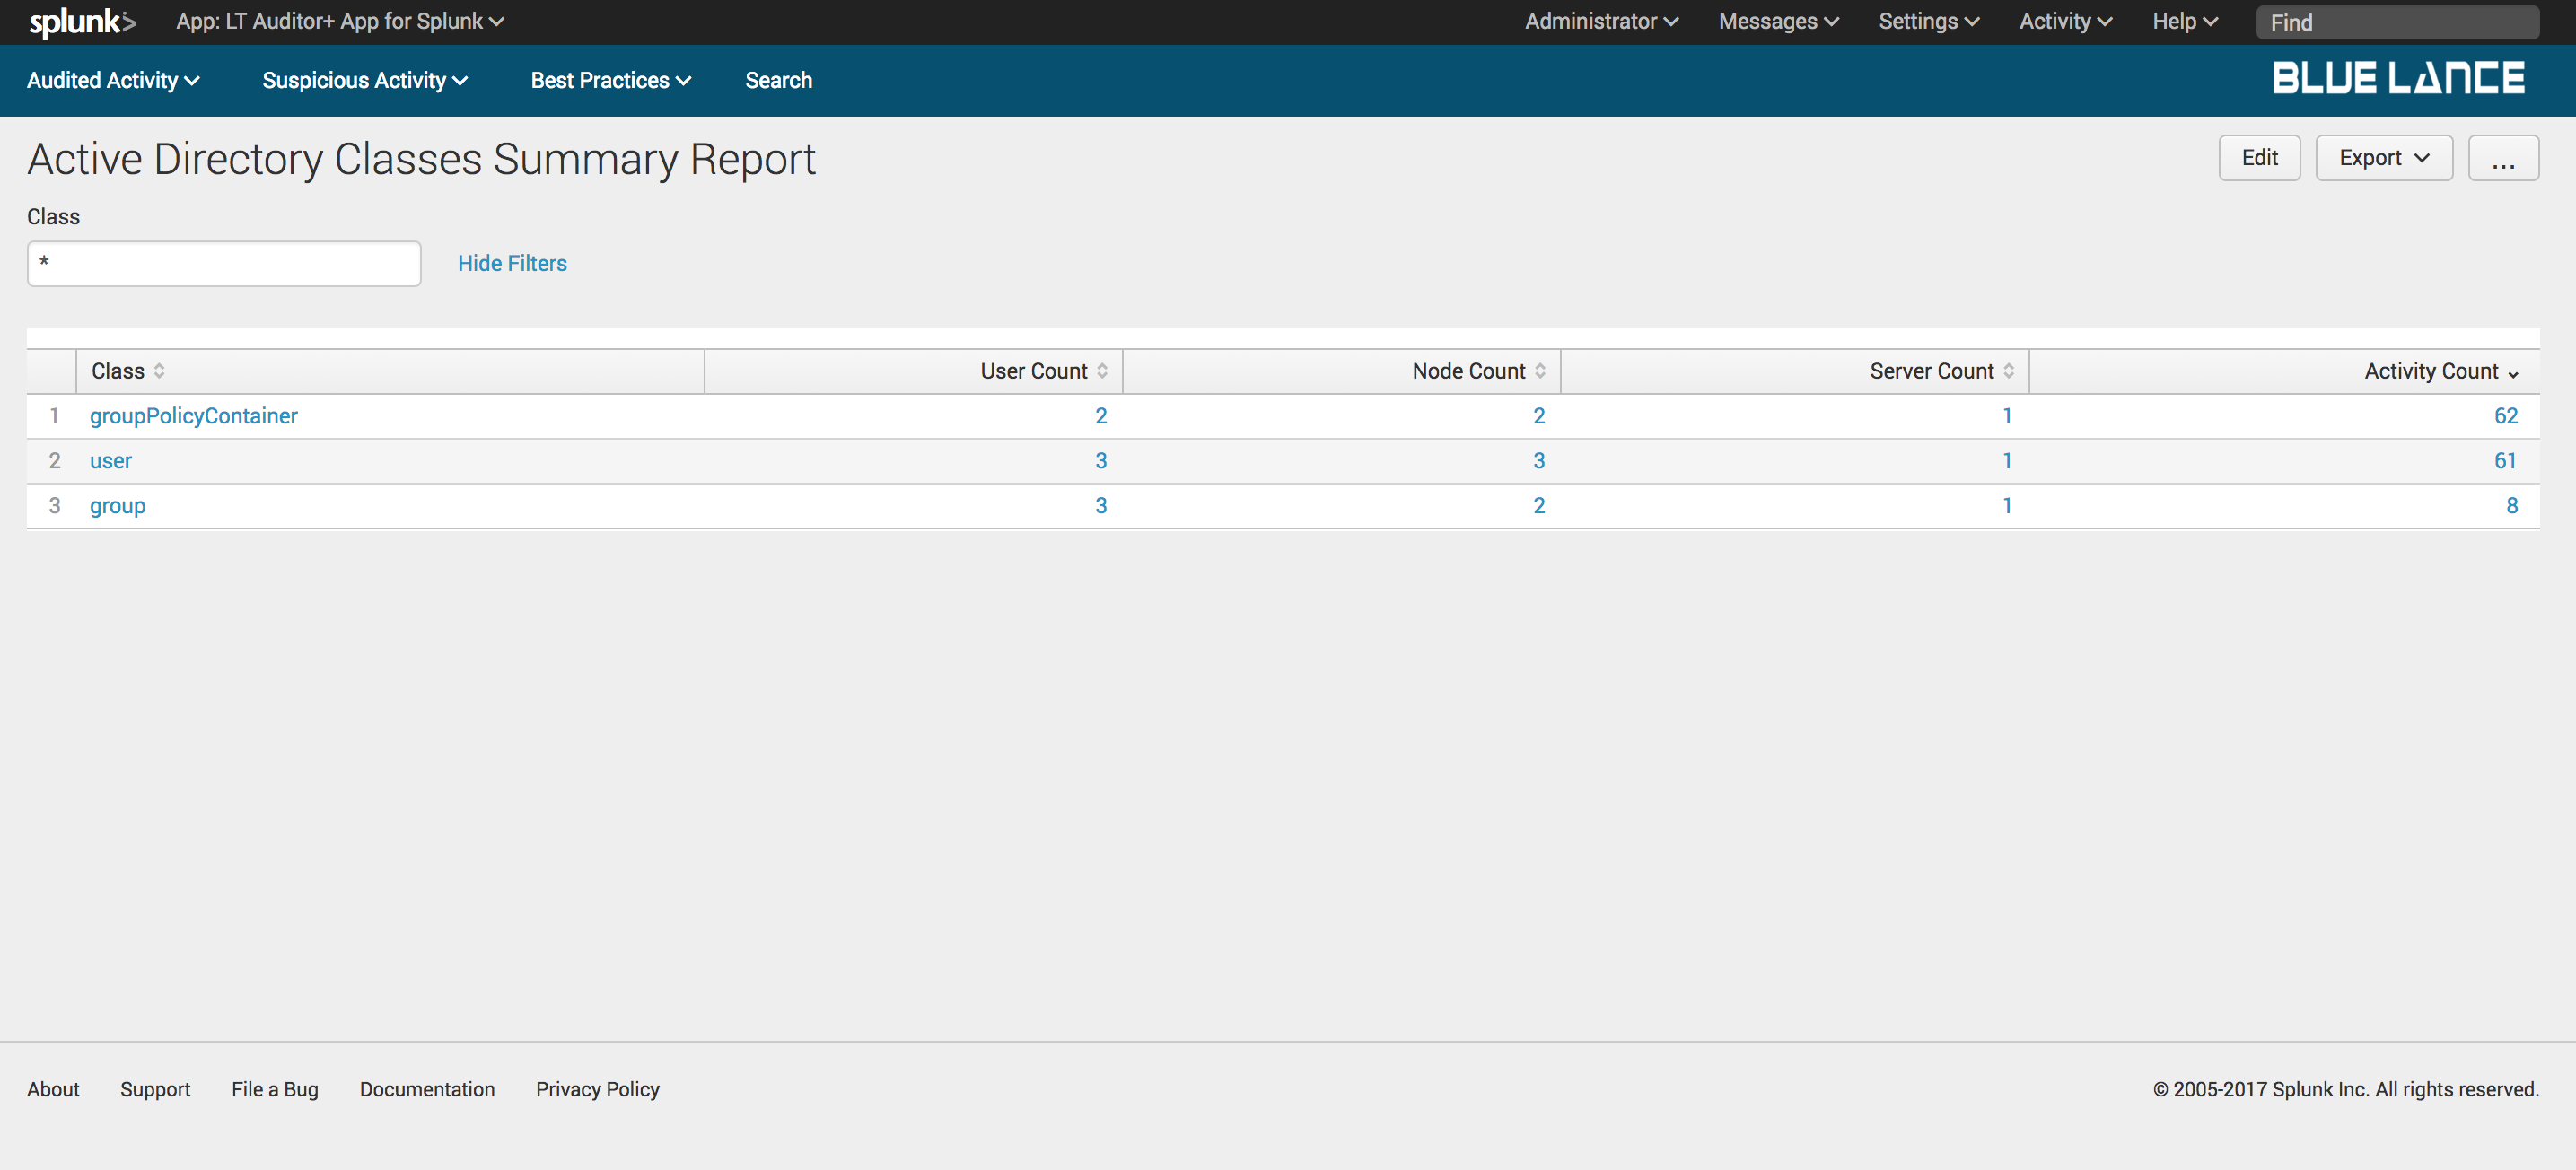
5.2.4.Users
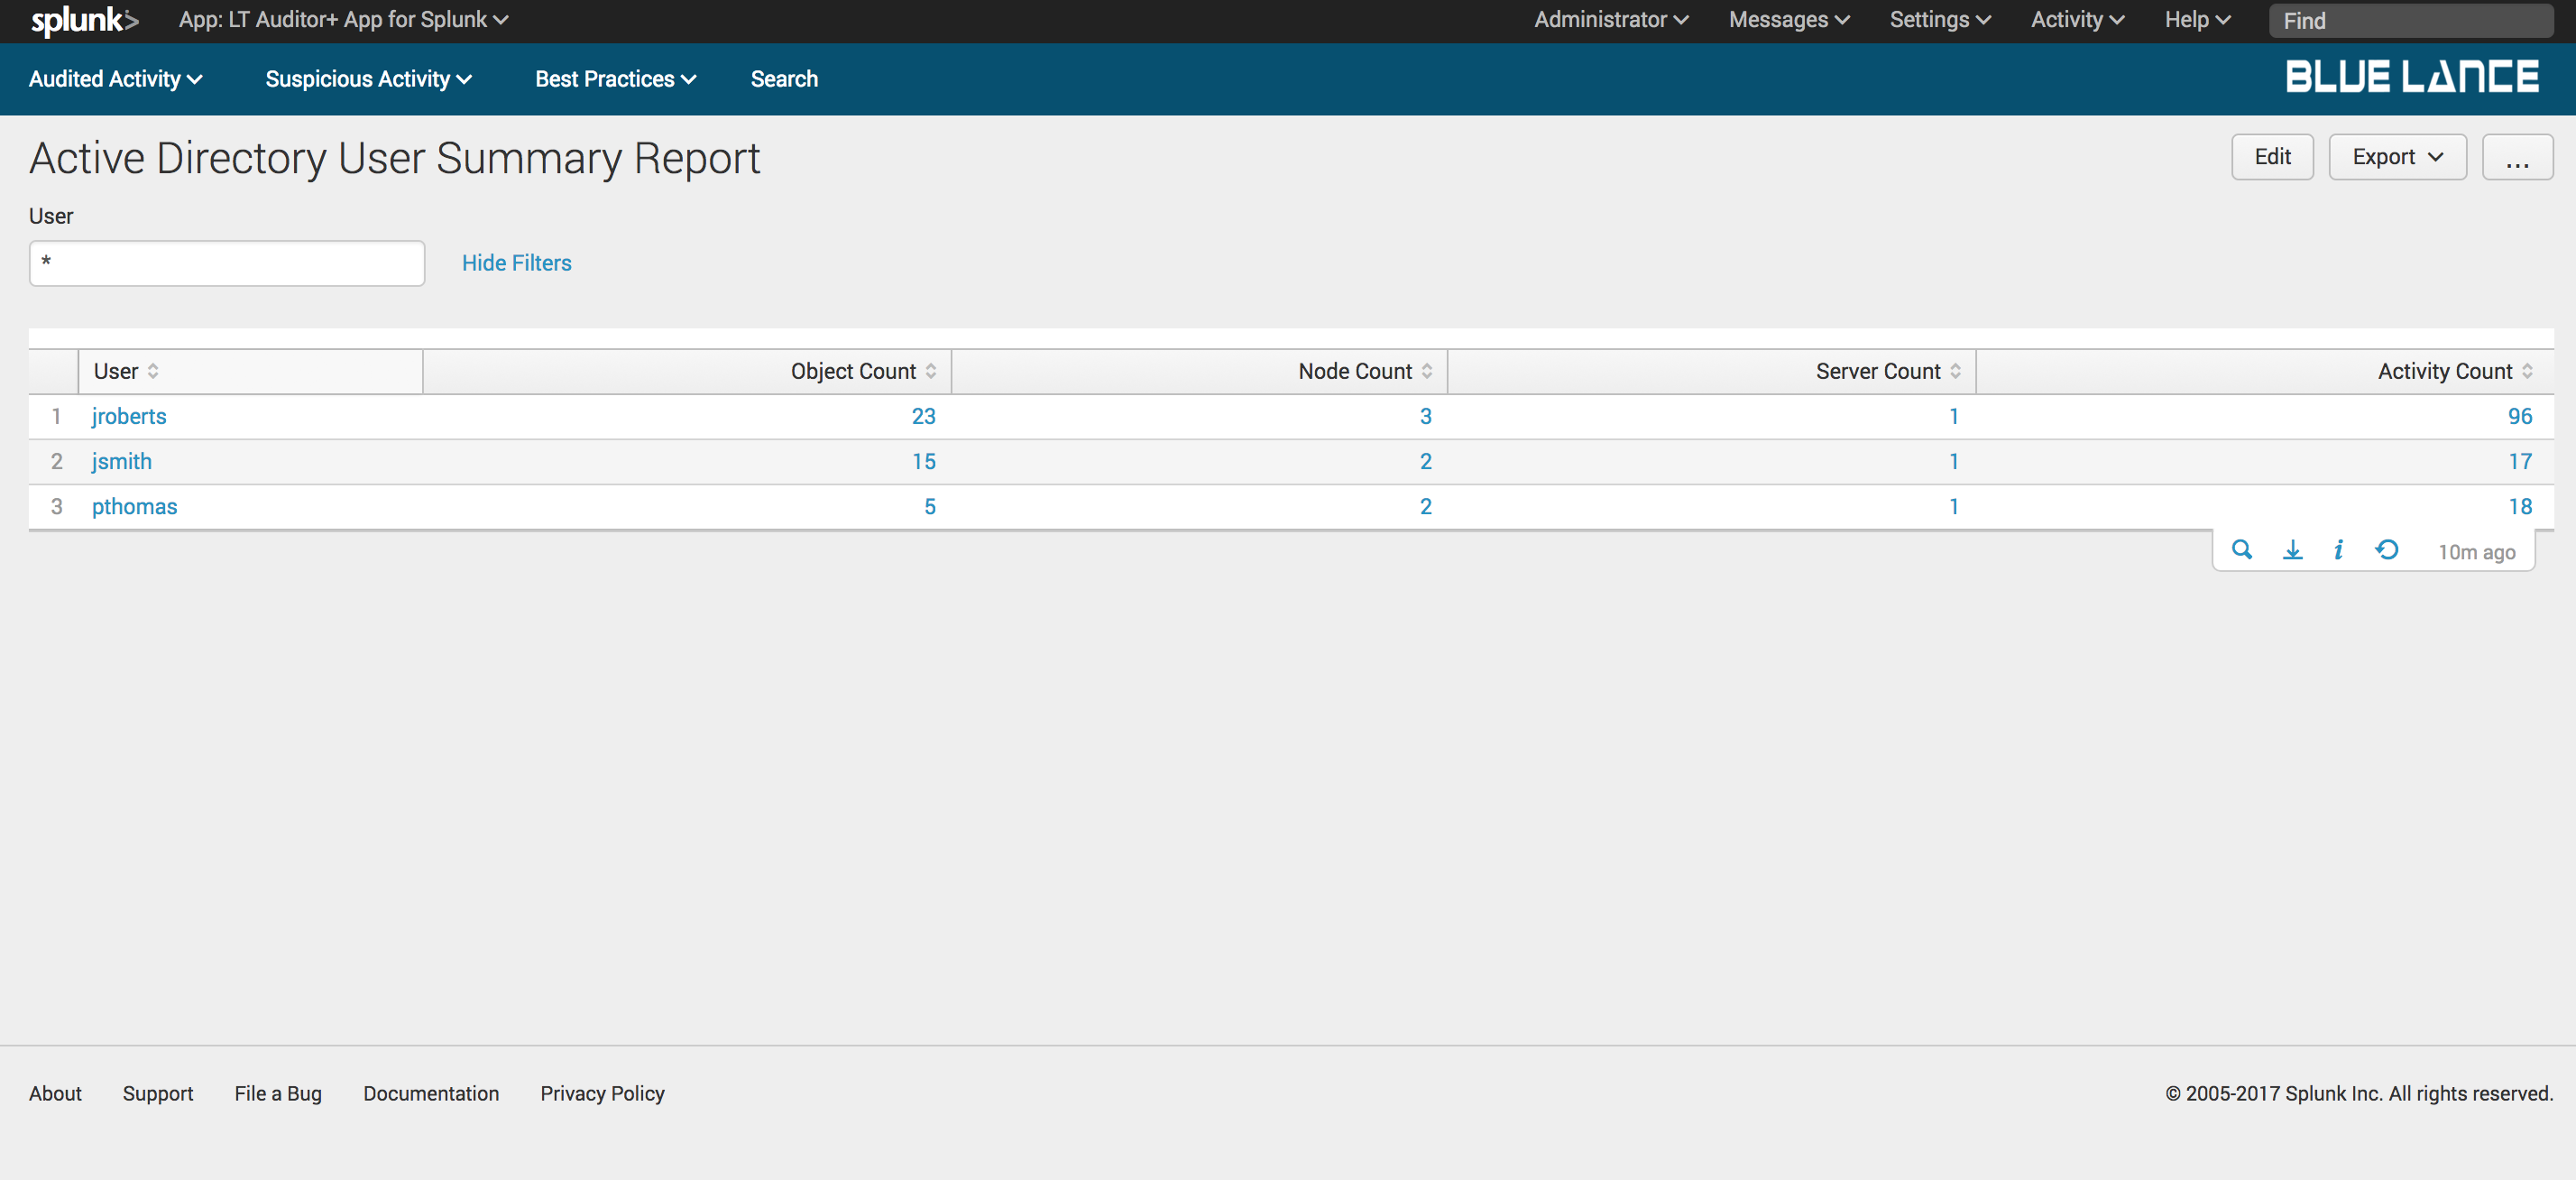
Users is a count of users that performed operations per filter criteria. Clicking on this notable generates a table summary of users with column counts of objects, nodes, servers and activity count as shown below. Clicking on any of the Userswill generate a detailed report of changes made by specified user.
5.2.5.Nodes
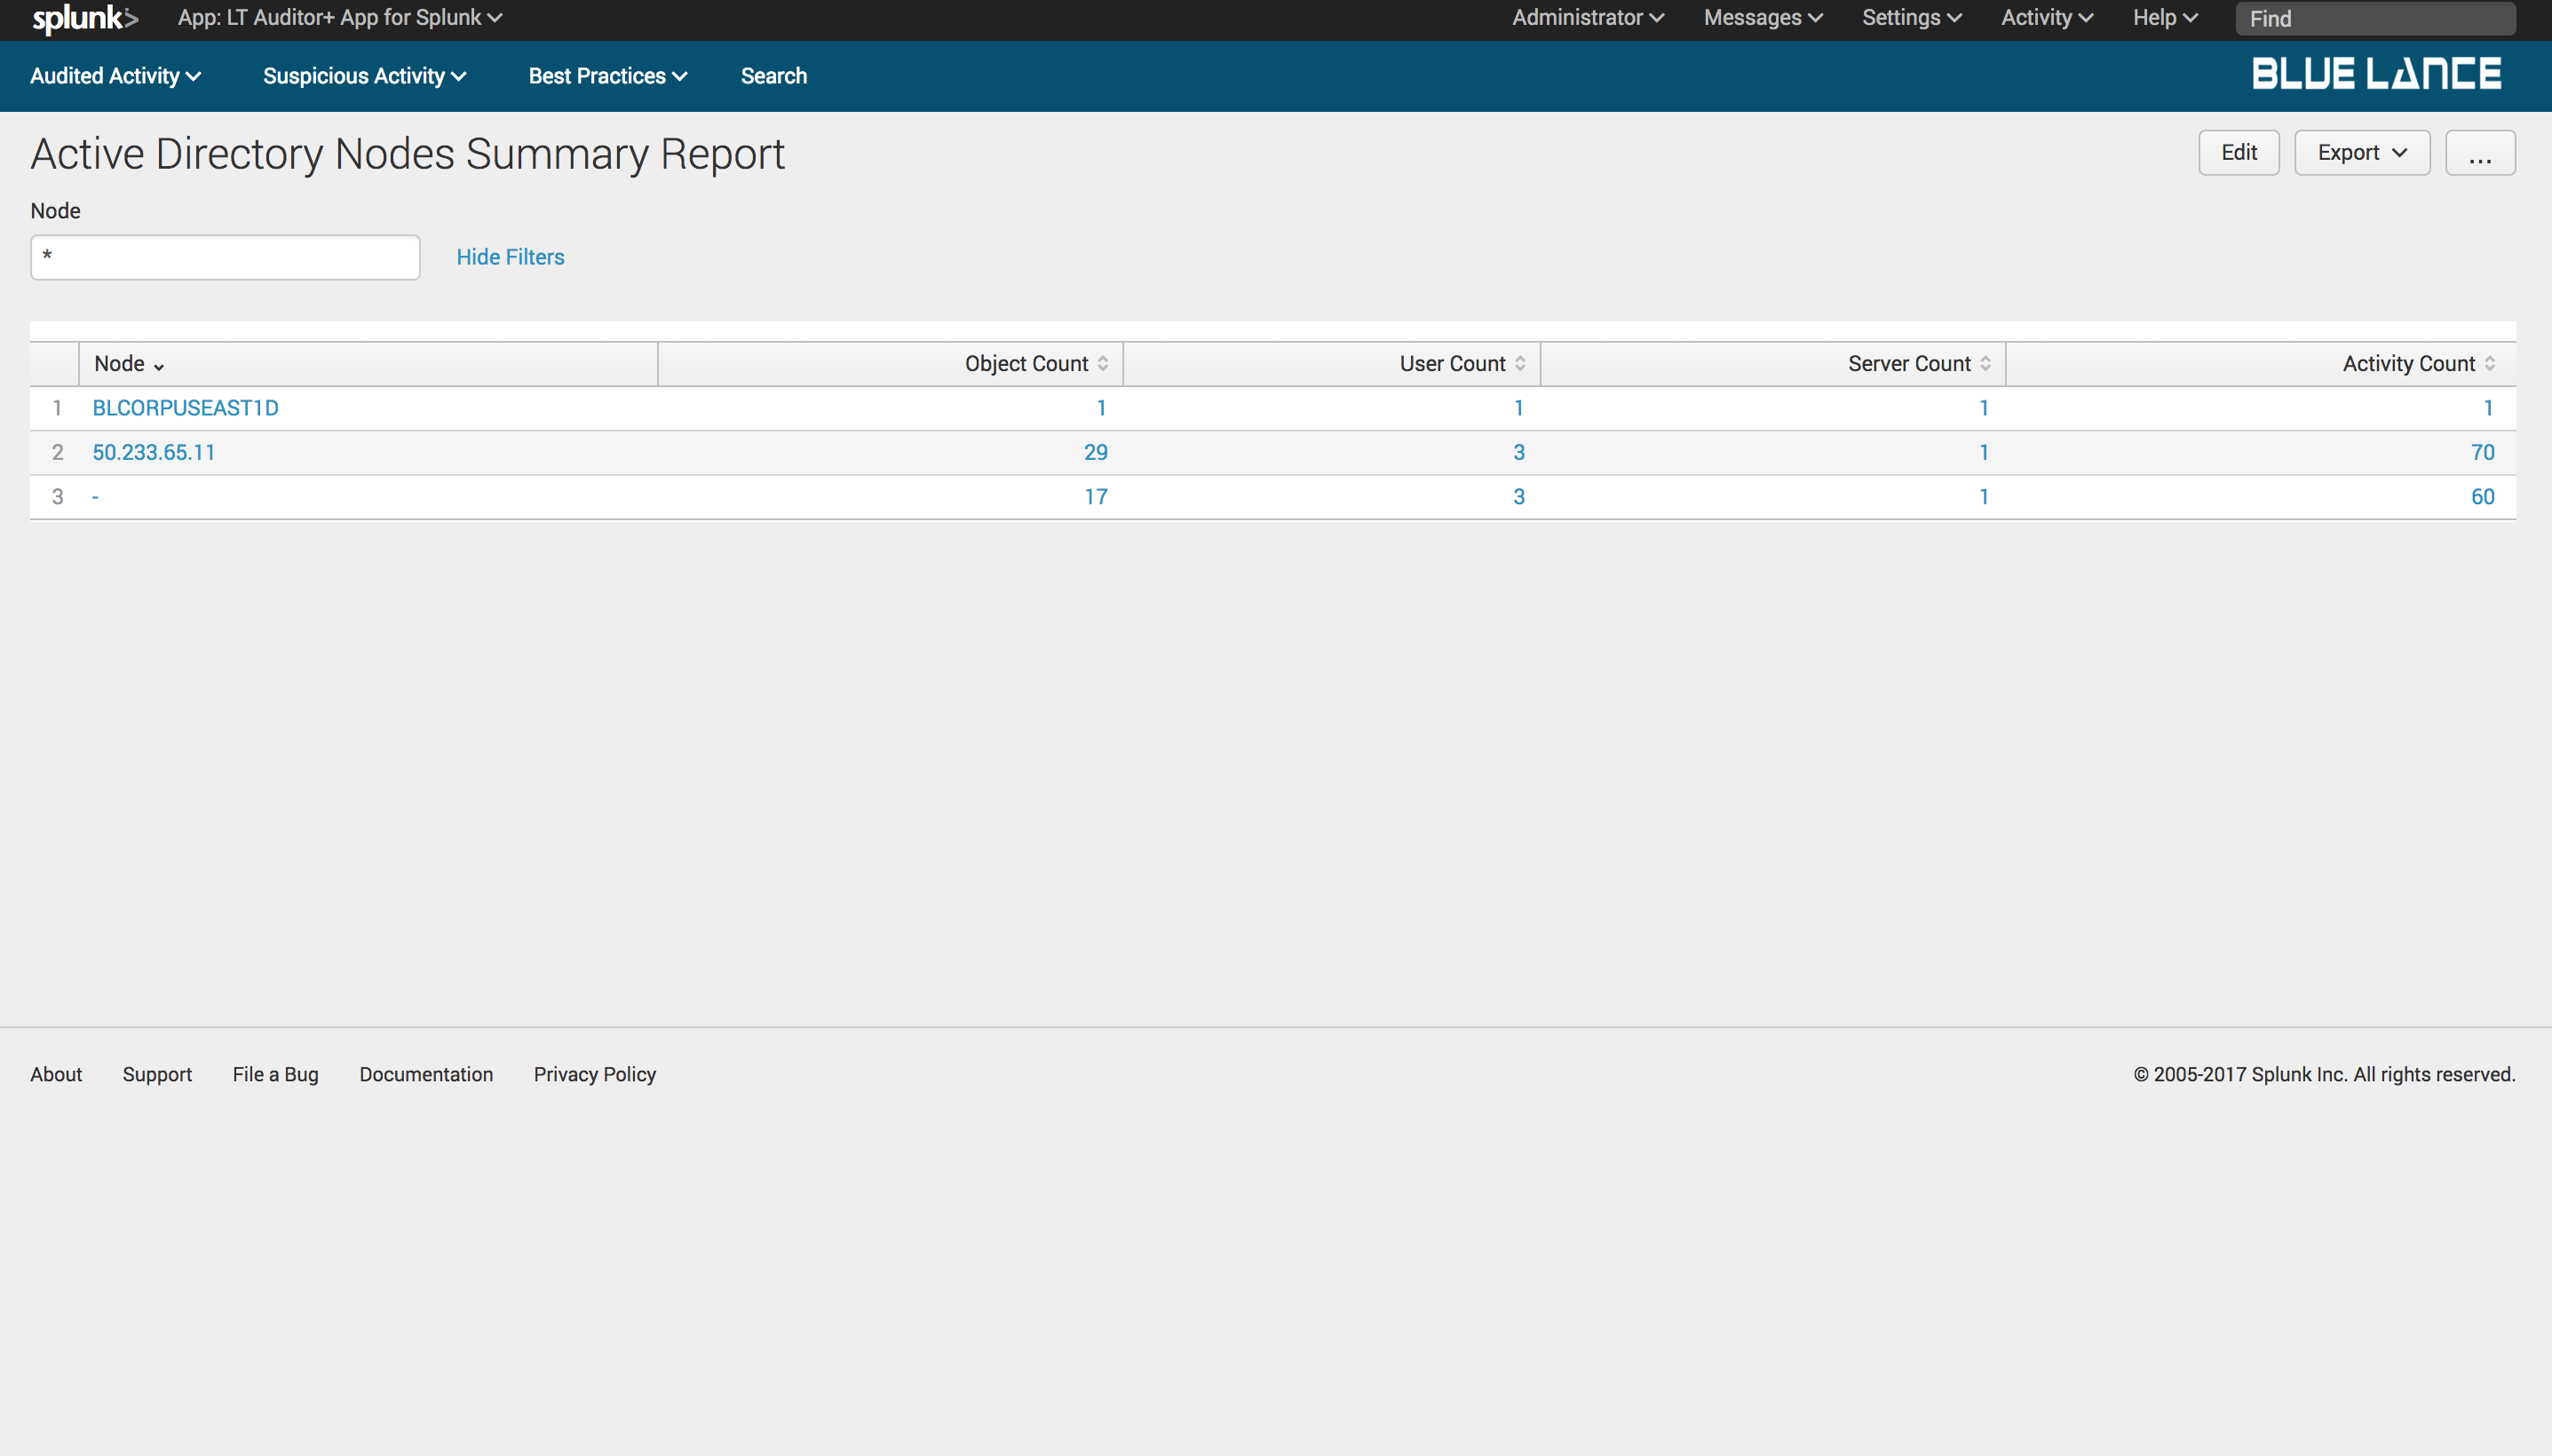
Nodes is a count of source node addresses of users that performed operations per filter criteria. Clicking on this notable generates a table summary of nodes with column counts of objects, users, servers and activity count as shown below. Clicking on any of the Nodes will generate a detailed report of changes made from specified node.
5.2.6.Servers
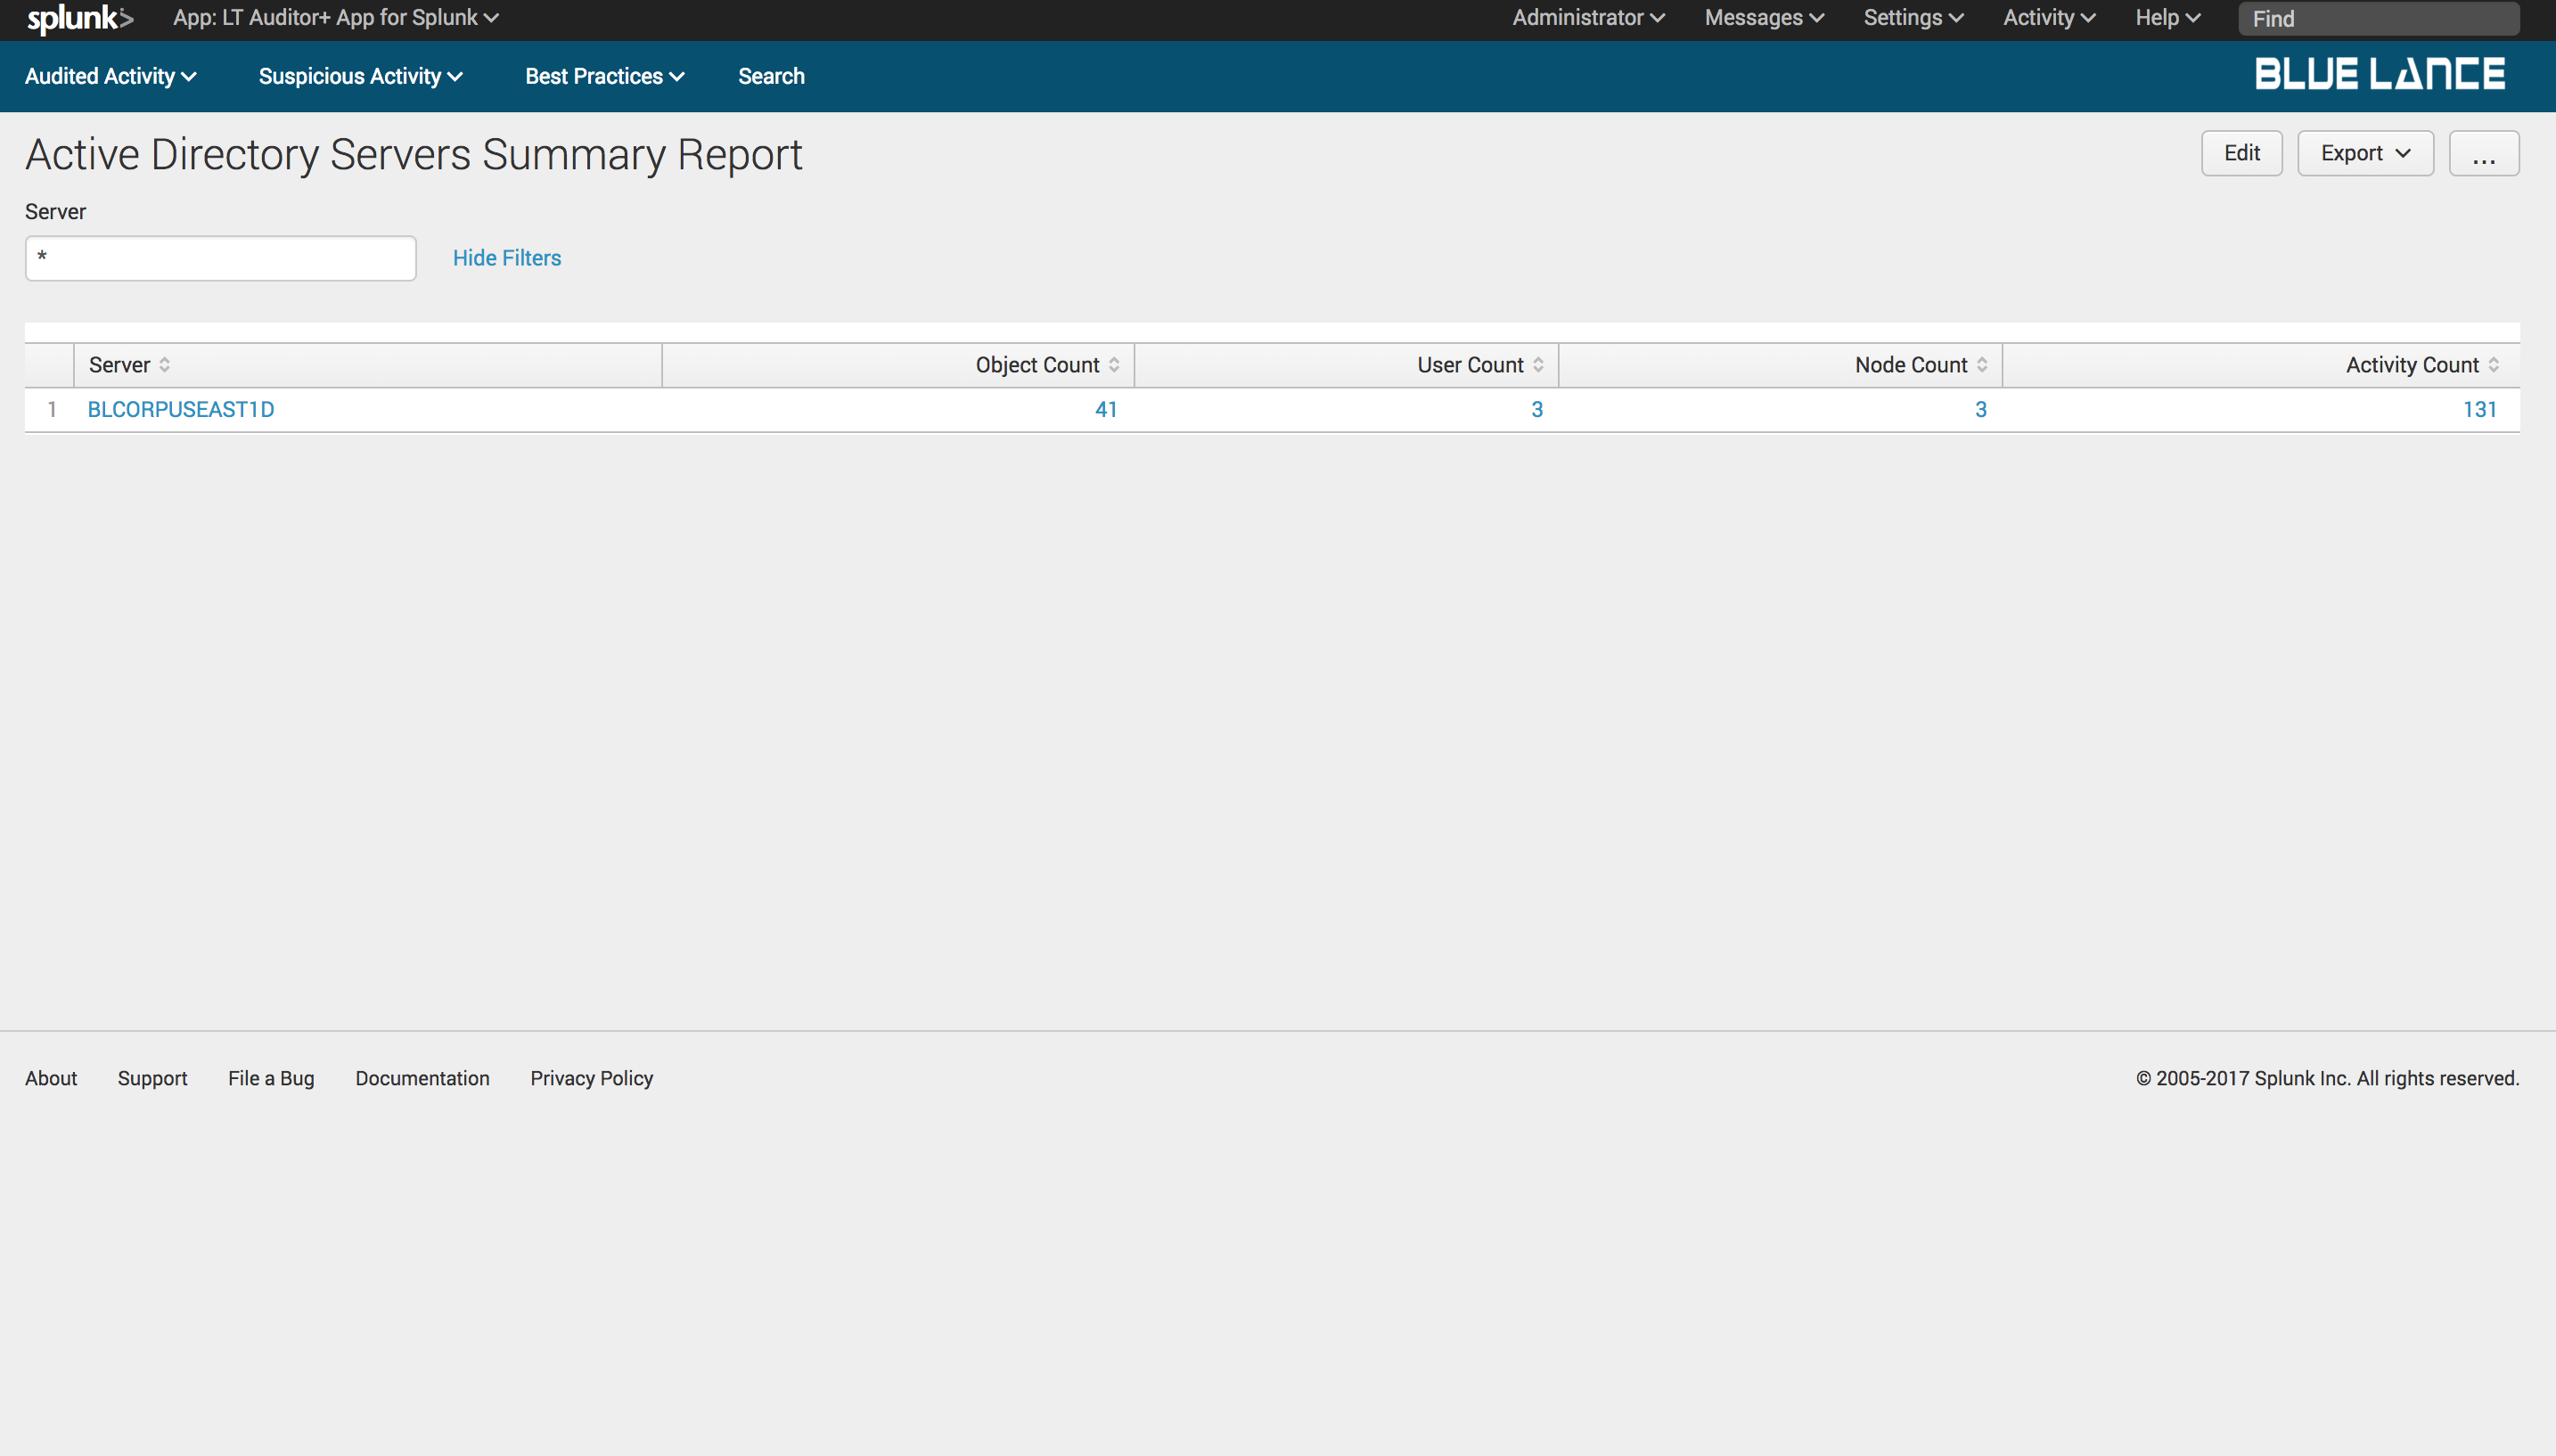
Servers is a count of host servers where changes occurred per filter criteria. Clicking on this notable generates a table summary of servers with column counts of objects, users, nodes and activity count as shown below. Clicking on any of the Servers will generate a detailed report of changes made on the specified server.
6.Group Policy Dashboard
The Group Policy dashboard provides complete details of all Group Policy activity recorded with LT Auditor+ as shown.
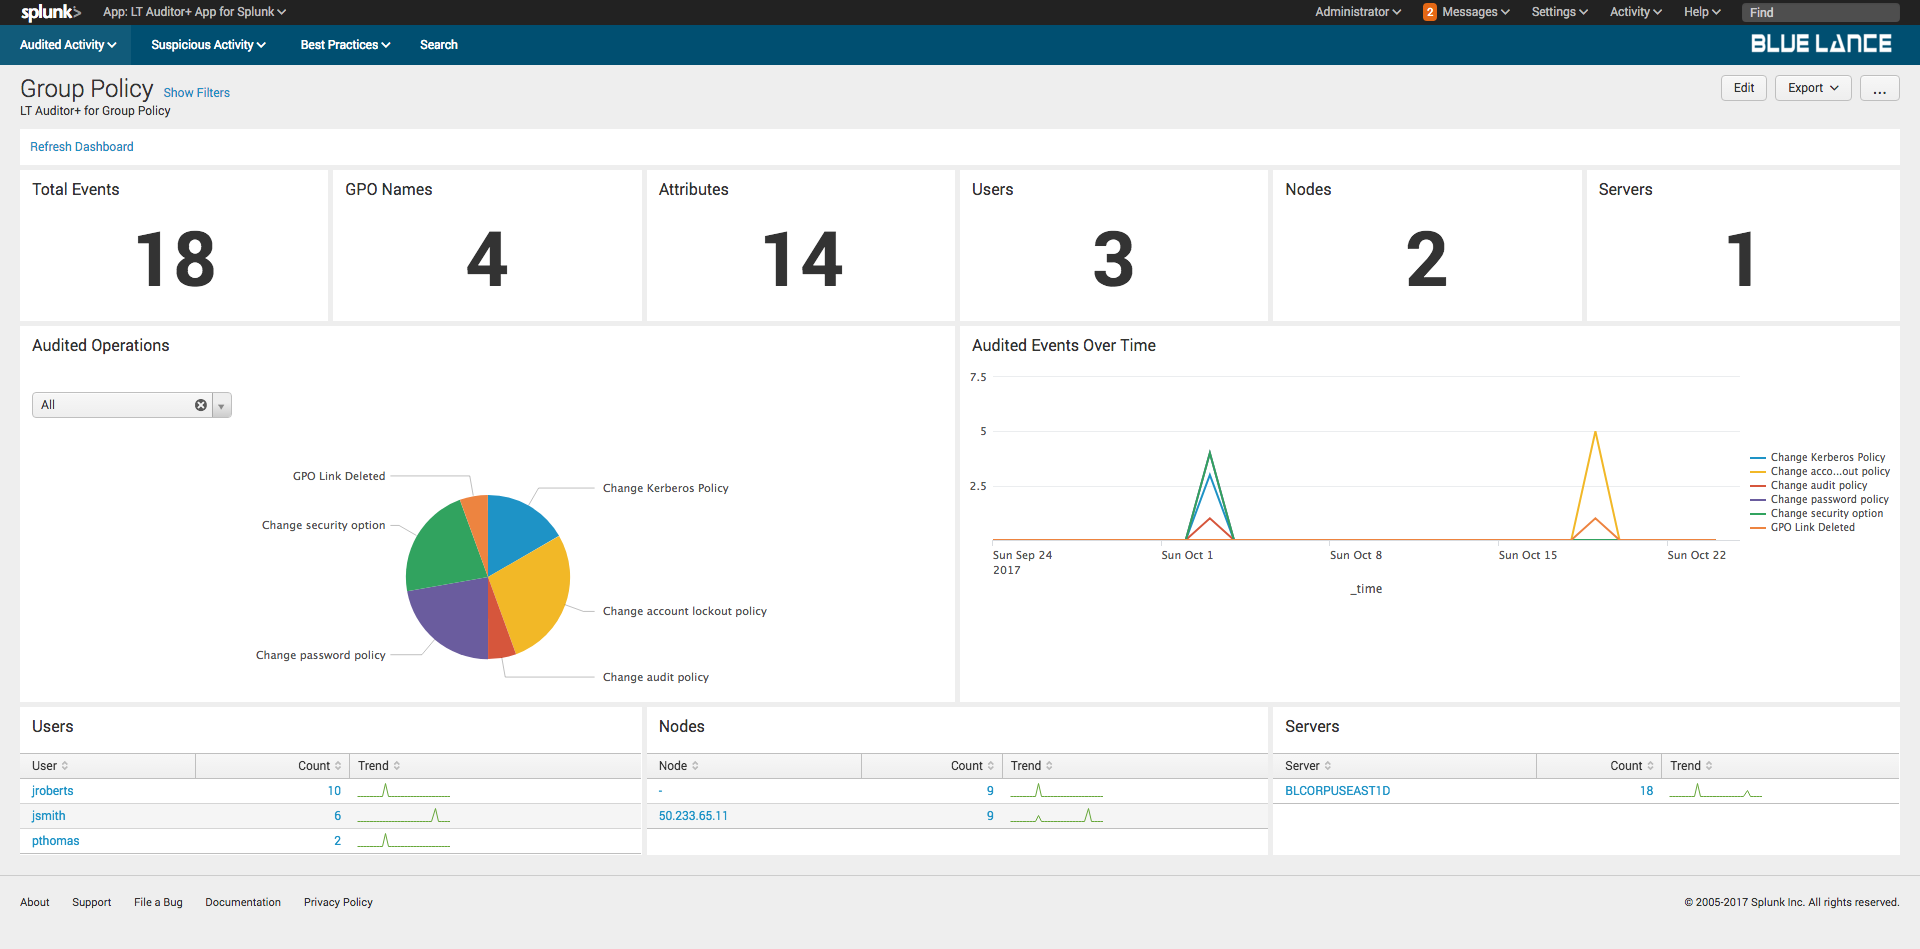
The dashboard has the following sections:
- Filters – Criteria can set to define content displayed on the dashboard;
- Notables – Summary of information about all activity that occurred;
- Audited Operations – Pie chart of specific operations for given filter criteria;
- Audited Events Over Time – Graphical representation of event modifications occurred for specified filter criteria;
- Users – List of all users making changes to cause the events to be recorded;
- Nodes – List of source nodes where changes were made from;
- Server – List of host servers where the changes occurred.
6.1.Filters
Click show filters to display query criteria for the dashboard as shown below. The dashboard will automatically update if criteria is specified in the filters.
Criteria can be configured based on:
- Time Frame
- GPO Name or Object
- Attribute or GPO Attribute
- Users
- Nodes
- Servers
6.2.Notables
The following section describe each of the Group Policy notables.
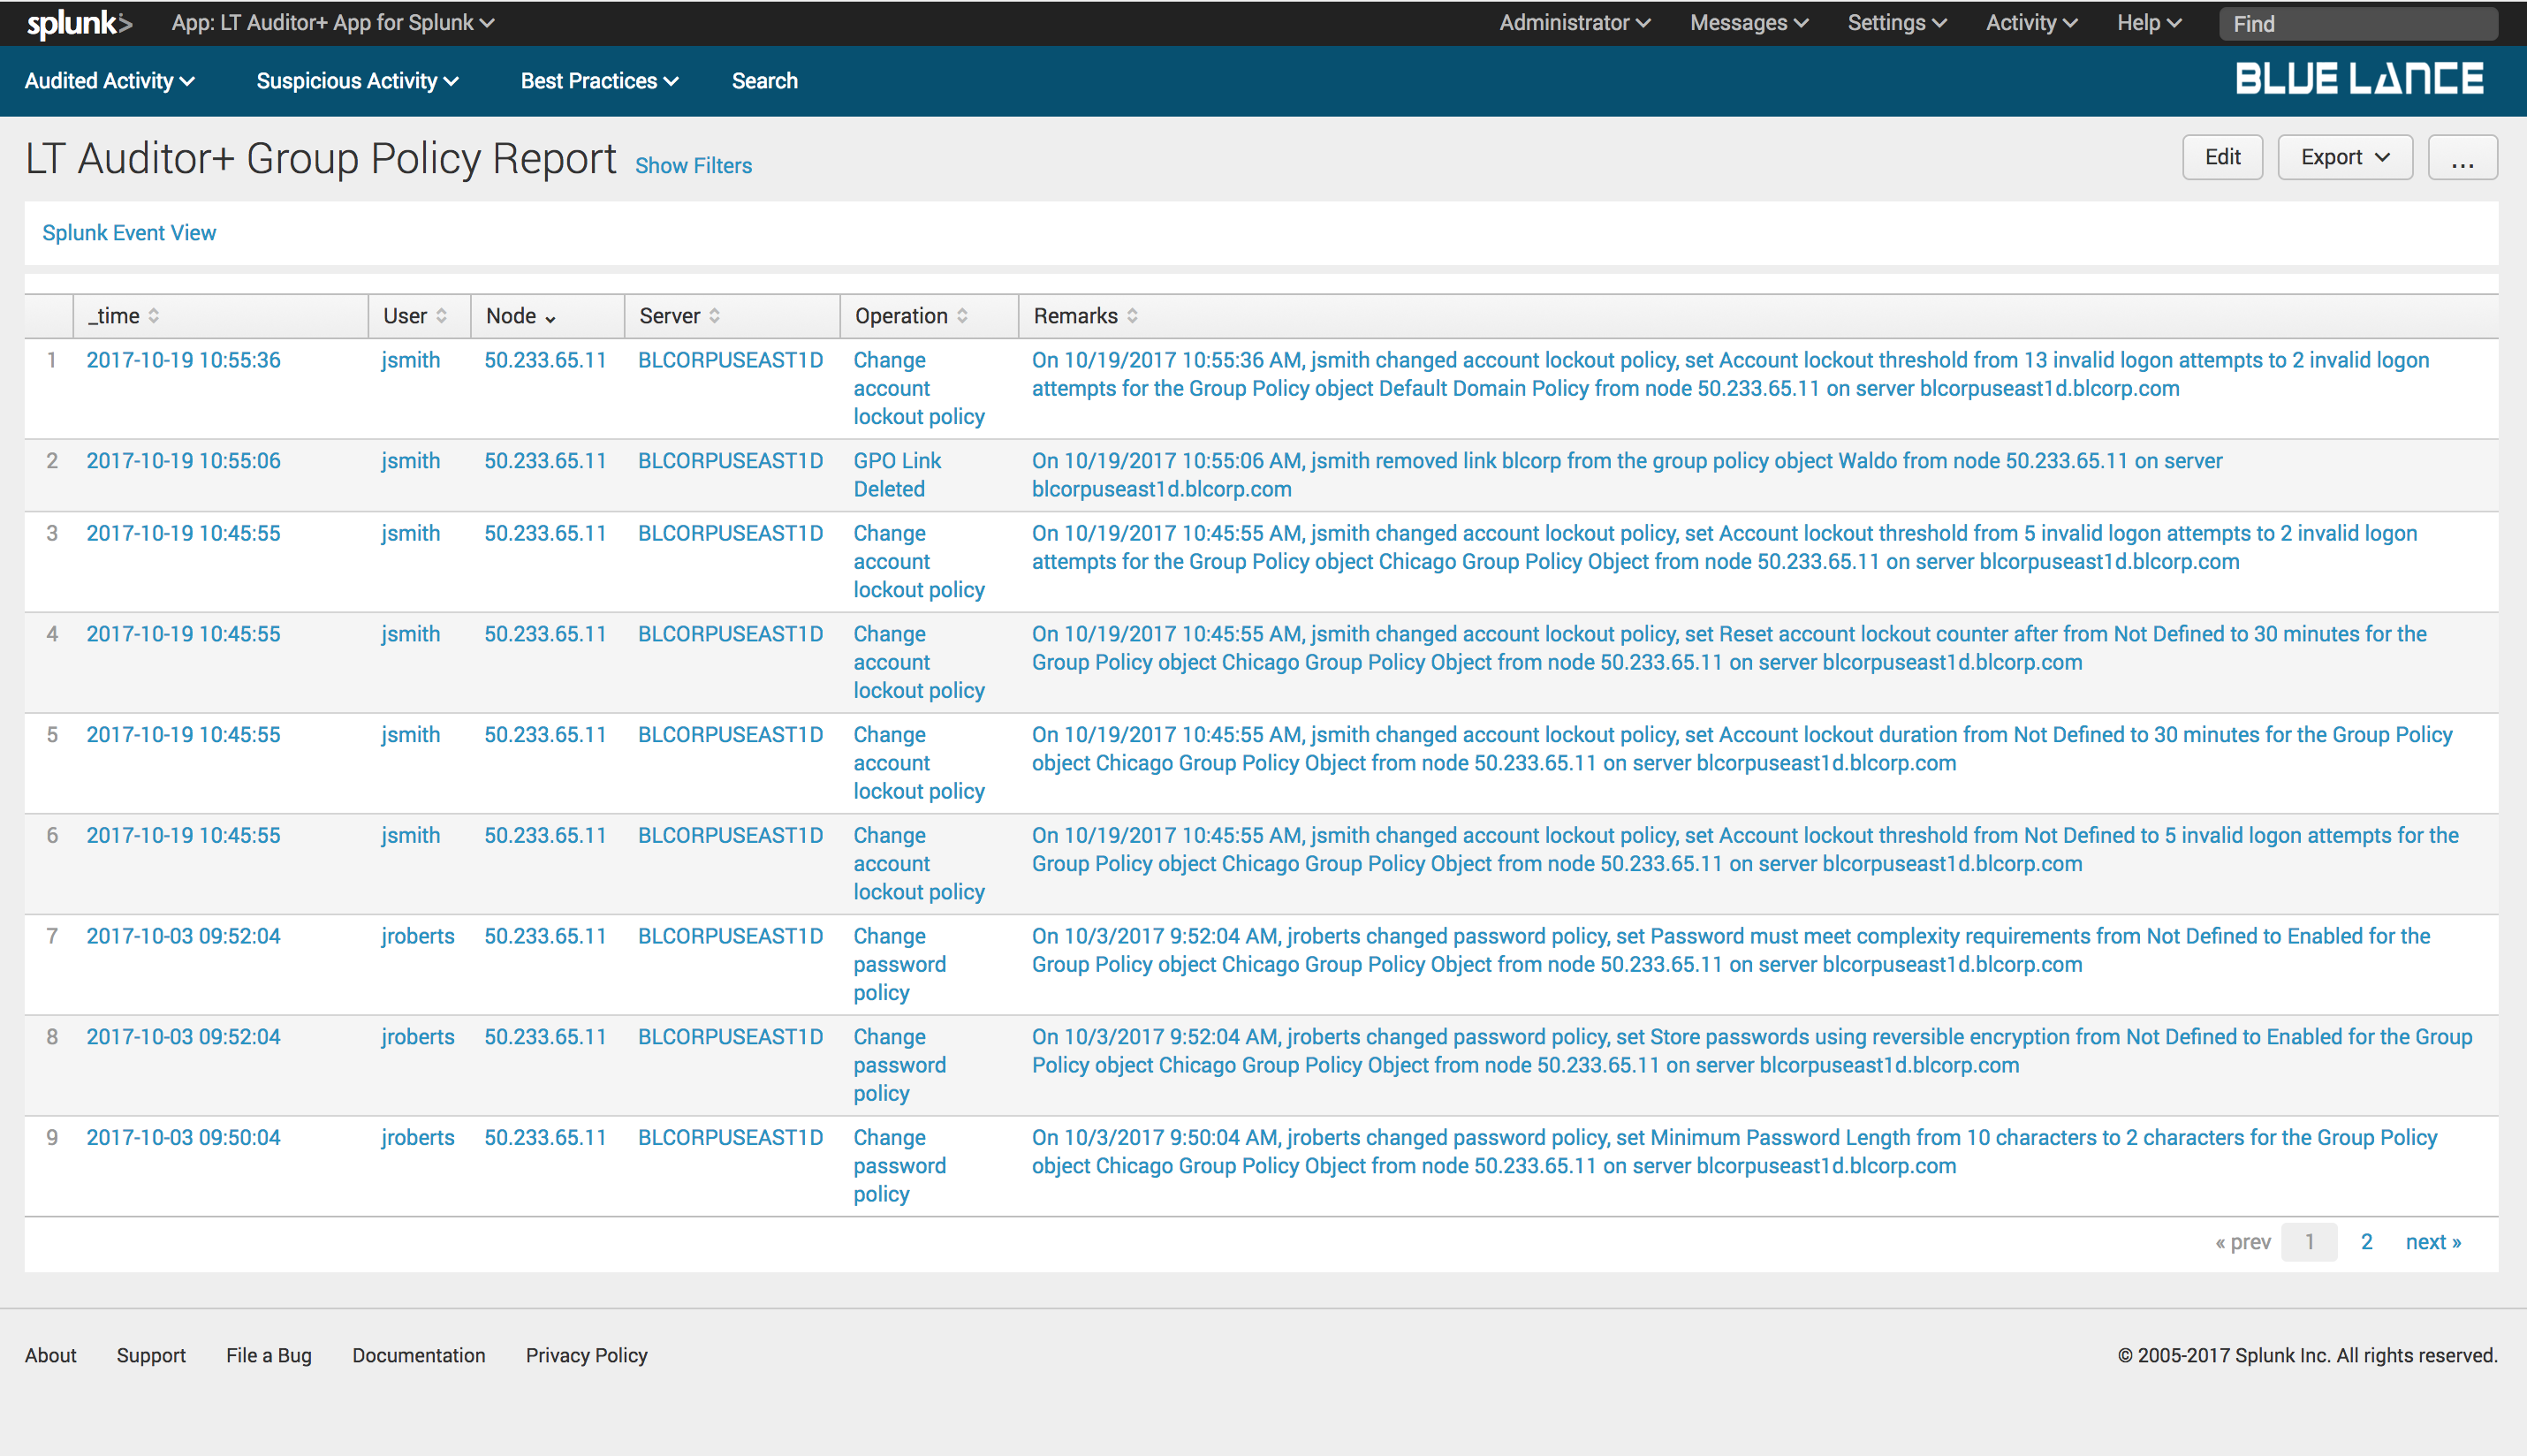
6.2.1.Total Events
Total Events is a count of all Group Policy events collected as per filter criteria. Clicking on this notable will generate a report of those events as shown below.
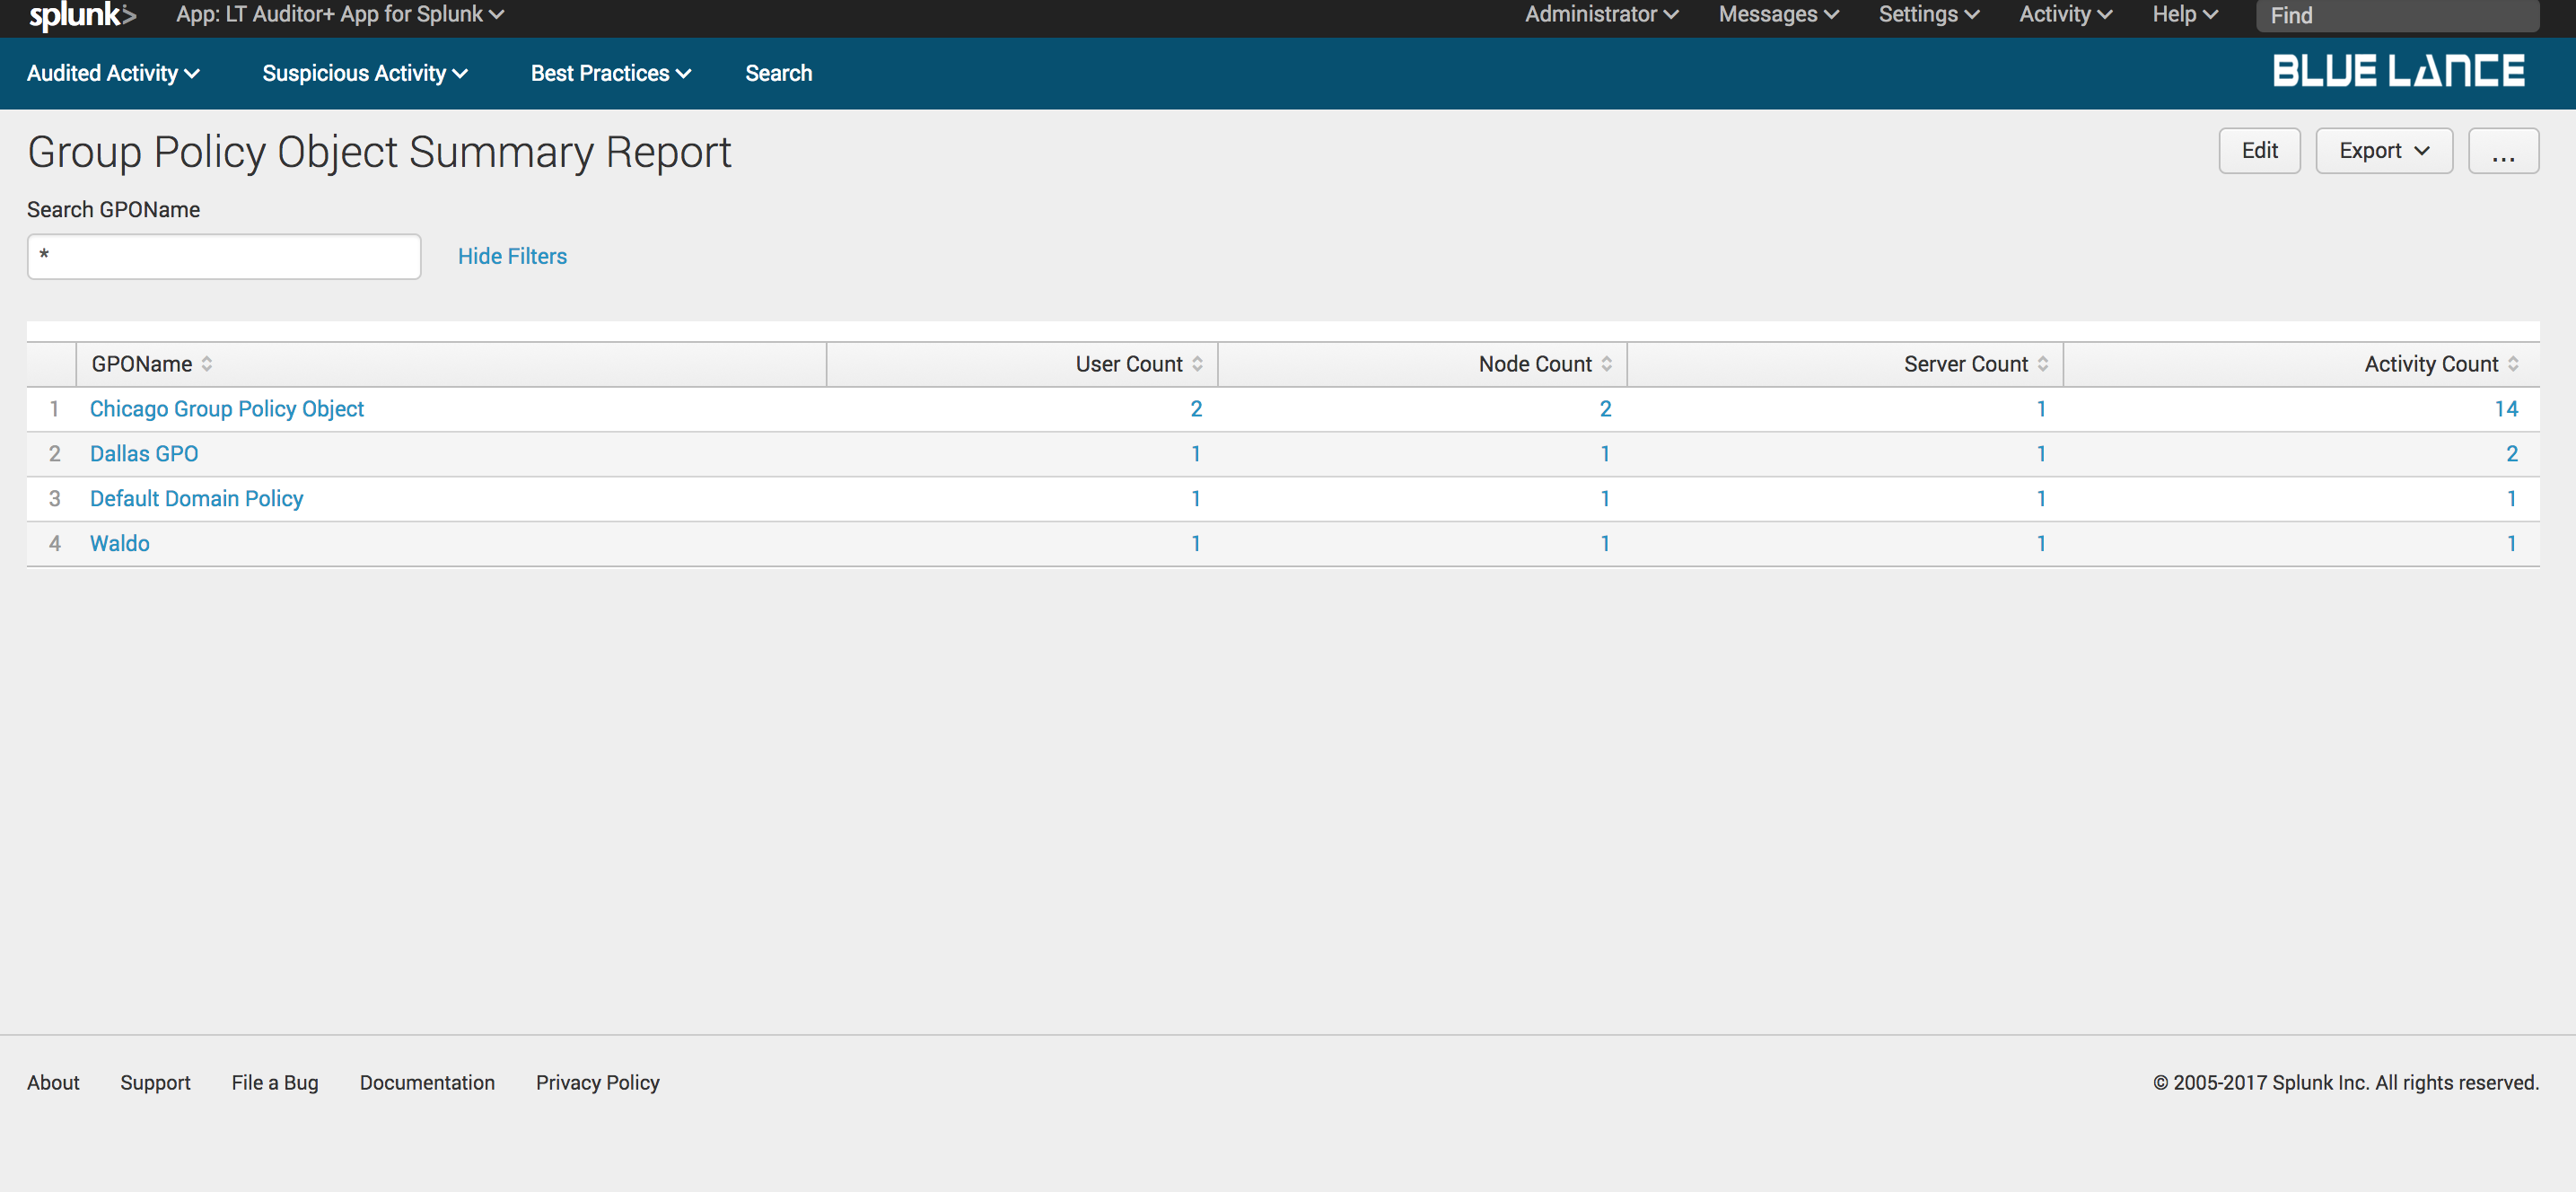
6.2.2.GPO Names
GPO Names is a count of distinct Group Policy objects modified per filter criteria. Clicking on this notable generates a table summary of these objects with column counts of users, nodes, servers and activity count as shown below. Clicking on any of the objects will generate a detailed report of changes on specified object.
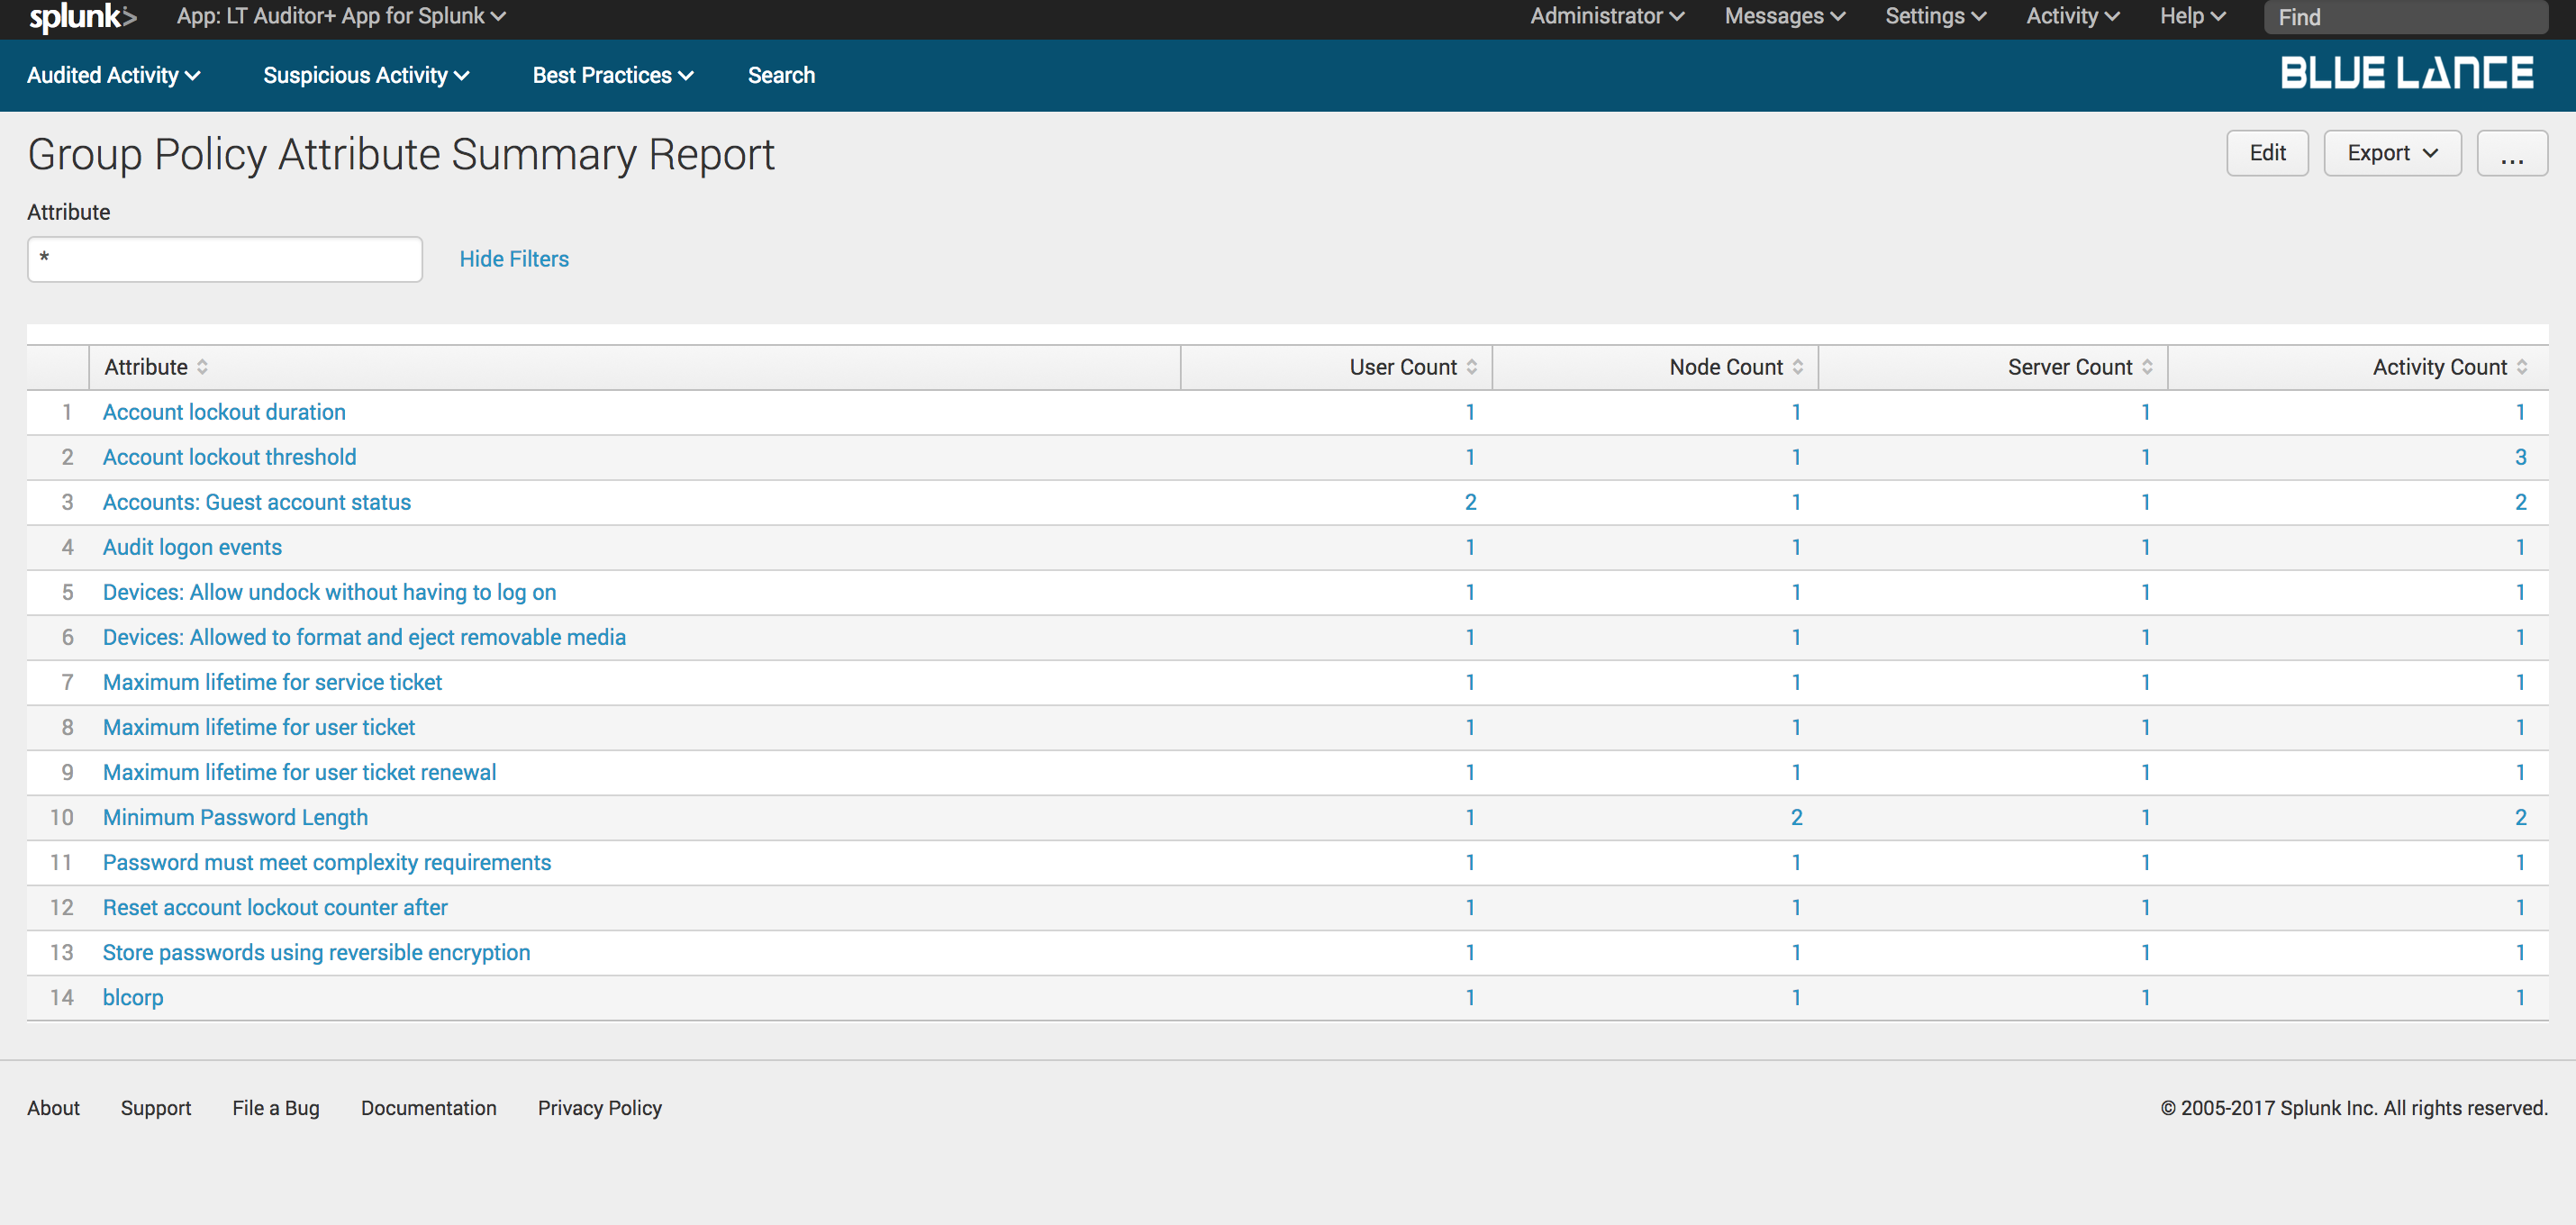
6.2.3.Attributes
Attributes is a count of distinct Group Policy attributes modified per filter criteria. Clicking on this notable generates a table summary of these attributes with column counts of users, nodes, servers and activity count as shown below. Clicking on any of the classes will generate a detailed report of changes on specified attribute.
6.2.4.Users, Nodes and Servers
These notables have the same functionality as described for the Active Directory dashboard.
7.Logon Server Dashboard
The Logon Server dashboard provides complete details of all login activity recorded with LT Auditor+ as shown.
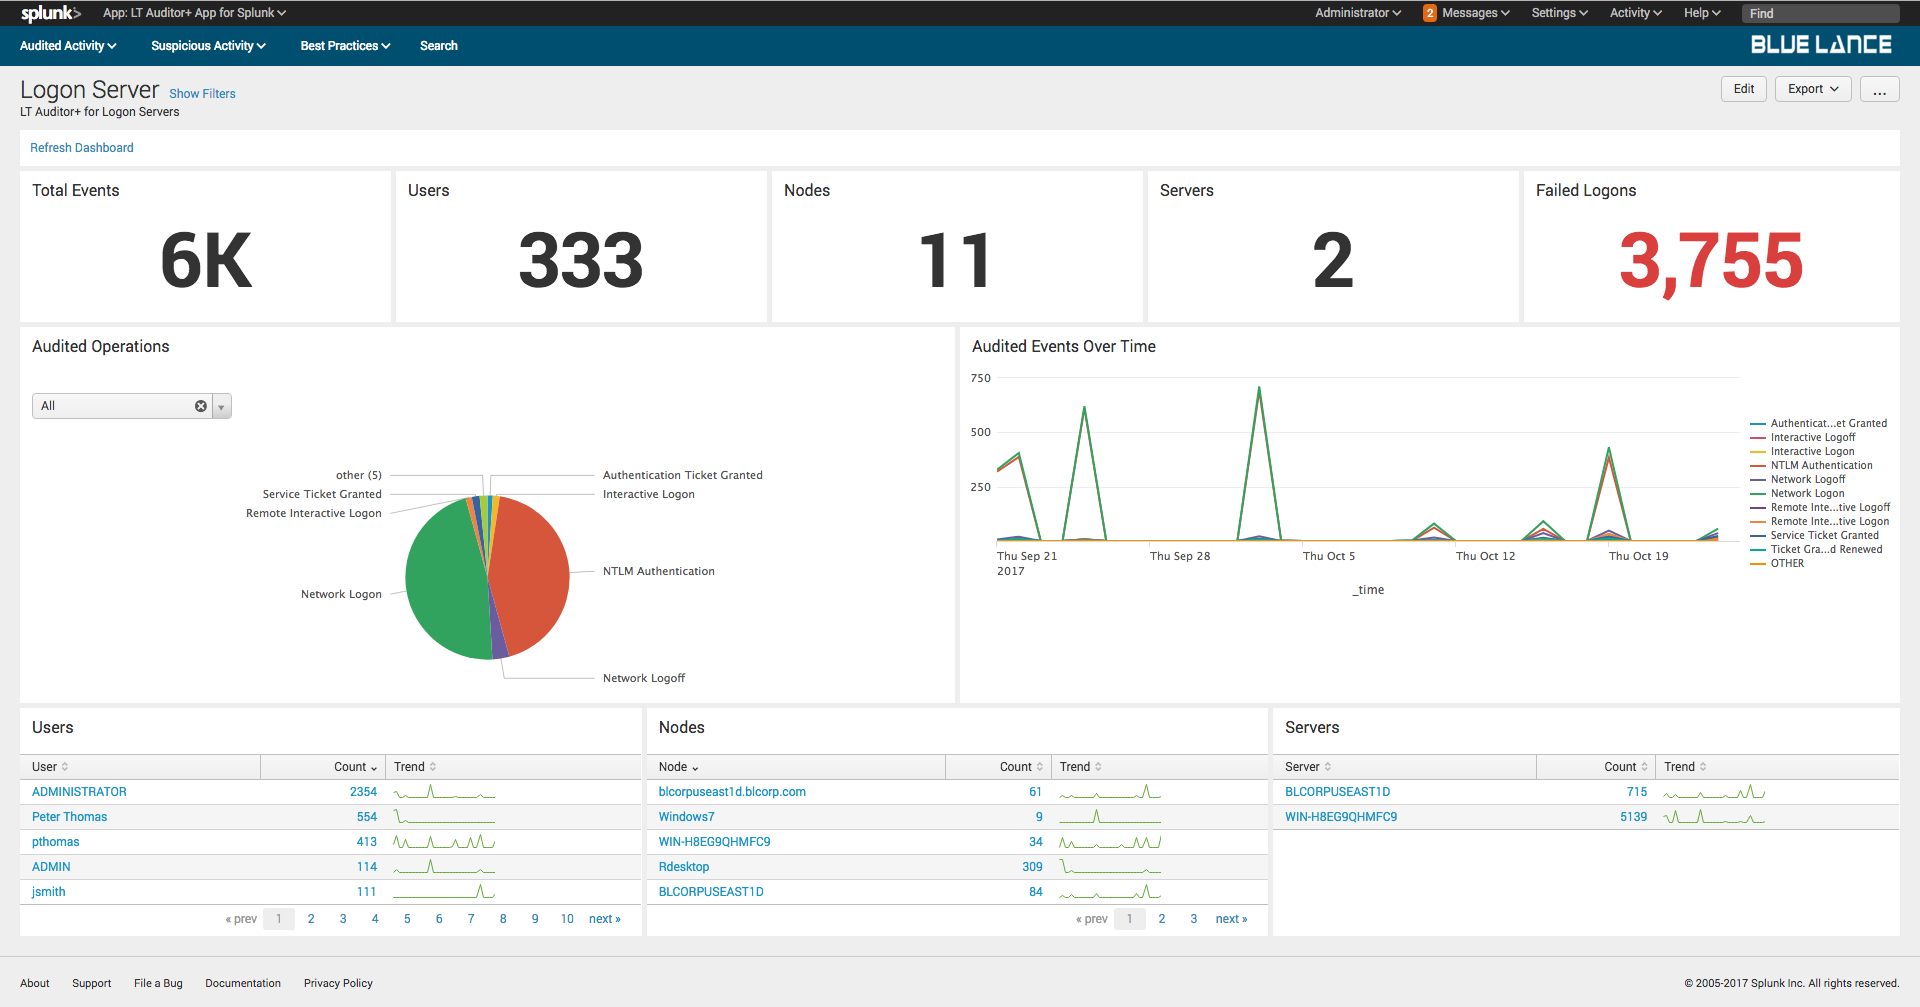
The dashboard has the following sections:
- Filters – Criteria can set to define content displayed on the dashboard;
- Notables – Summary of information about all activity that occurred;
- Audited Operations – Pie chart of specific operations for given filter criteria;
- Audited Events Over Time – Graphical representation of event modifications occurred for specified filter criteria;
- Users – List of all users making changes to cause the events to be recorded;
- Nodes – List of source nodes where changes were made from;
- Server – List of host servers where the changes occurred.
7.1.Filters
Click show filters to display query criteria for the dashboard as shown below. The dashboard will automatically update if criteria is specified in the filters.
Criteria can be configured based on:
- Time Frame
- Users
- Nodes
- Servers
7.2.Notables
The following section describe each of the Logon Server notables.
7.2.1.Total Events
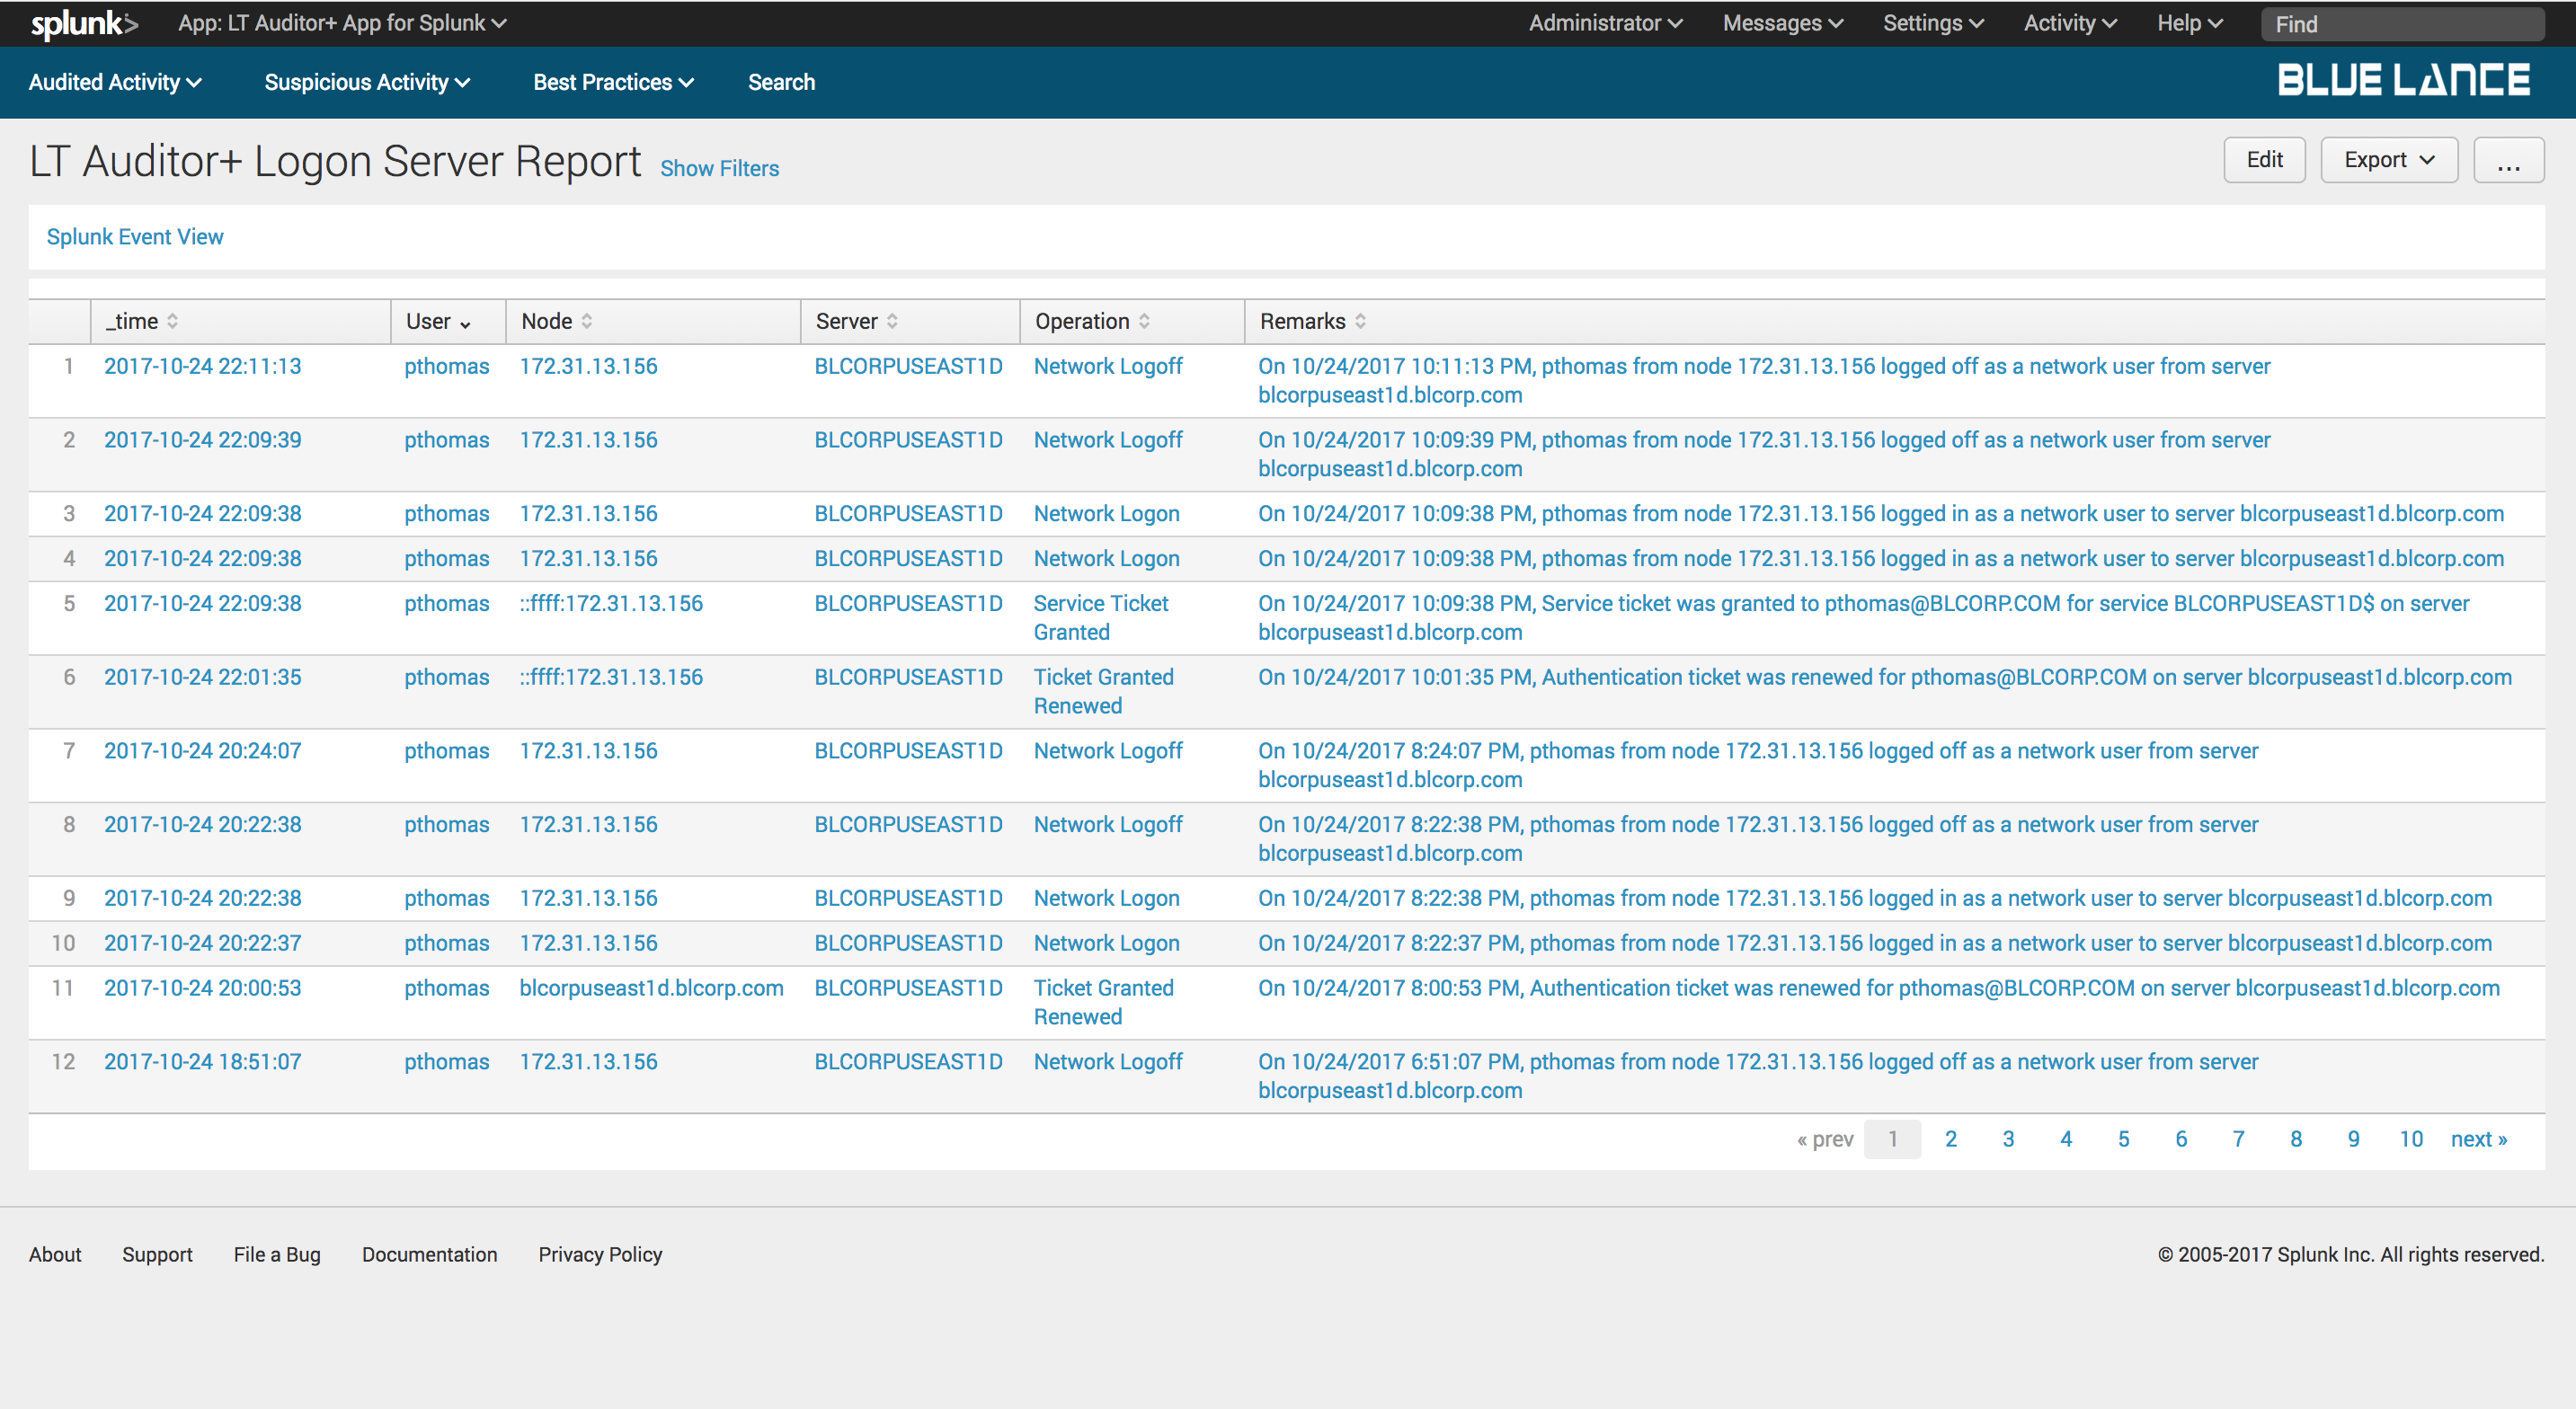
Total Events is a count of all login events collected as per filter criteria. Clicking on this notable will generate a report of those events as shown below.
7.2.2.Users, Nodes and Servers
These notables have the same functionality as described for the Active Directory dashboard.
7.2.3.Failed Logons
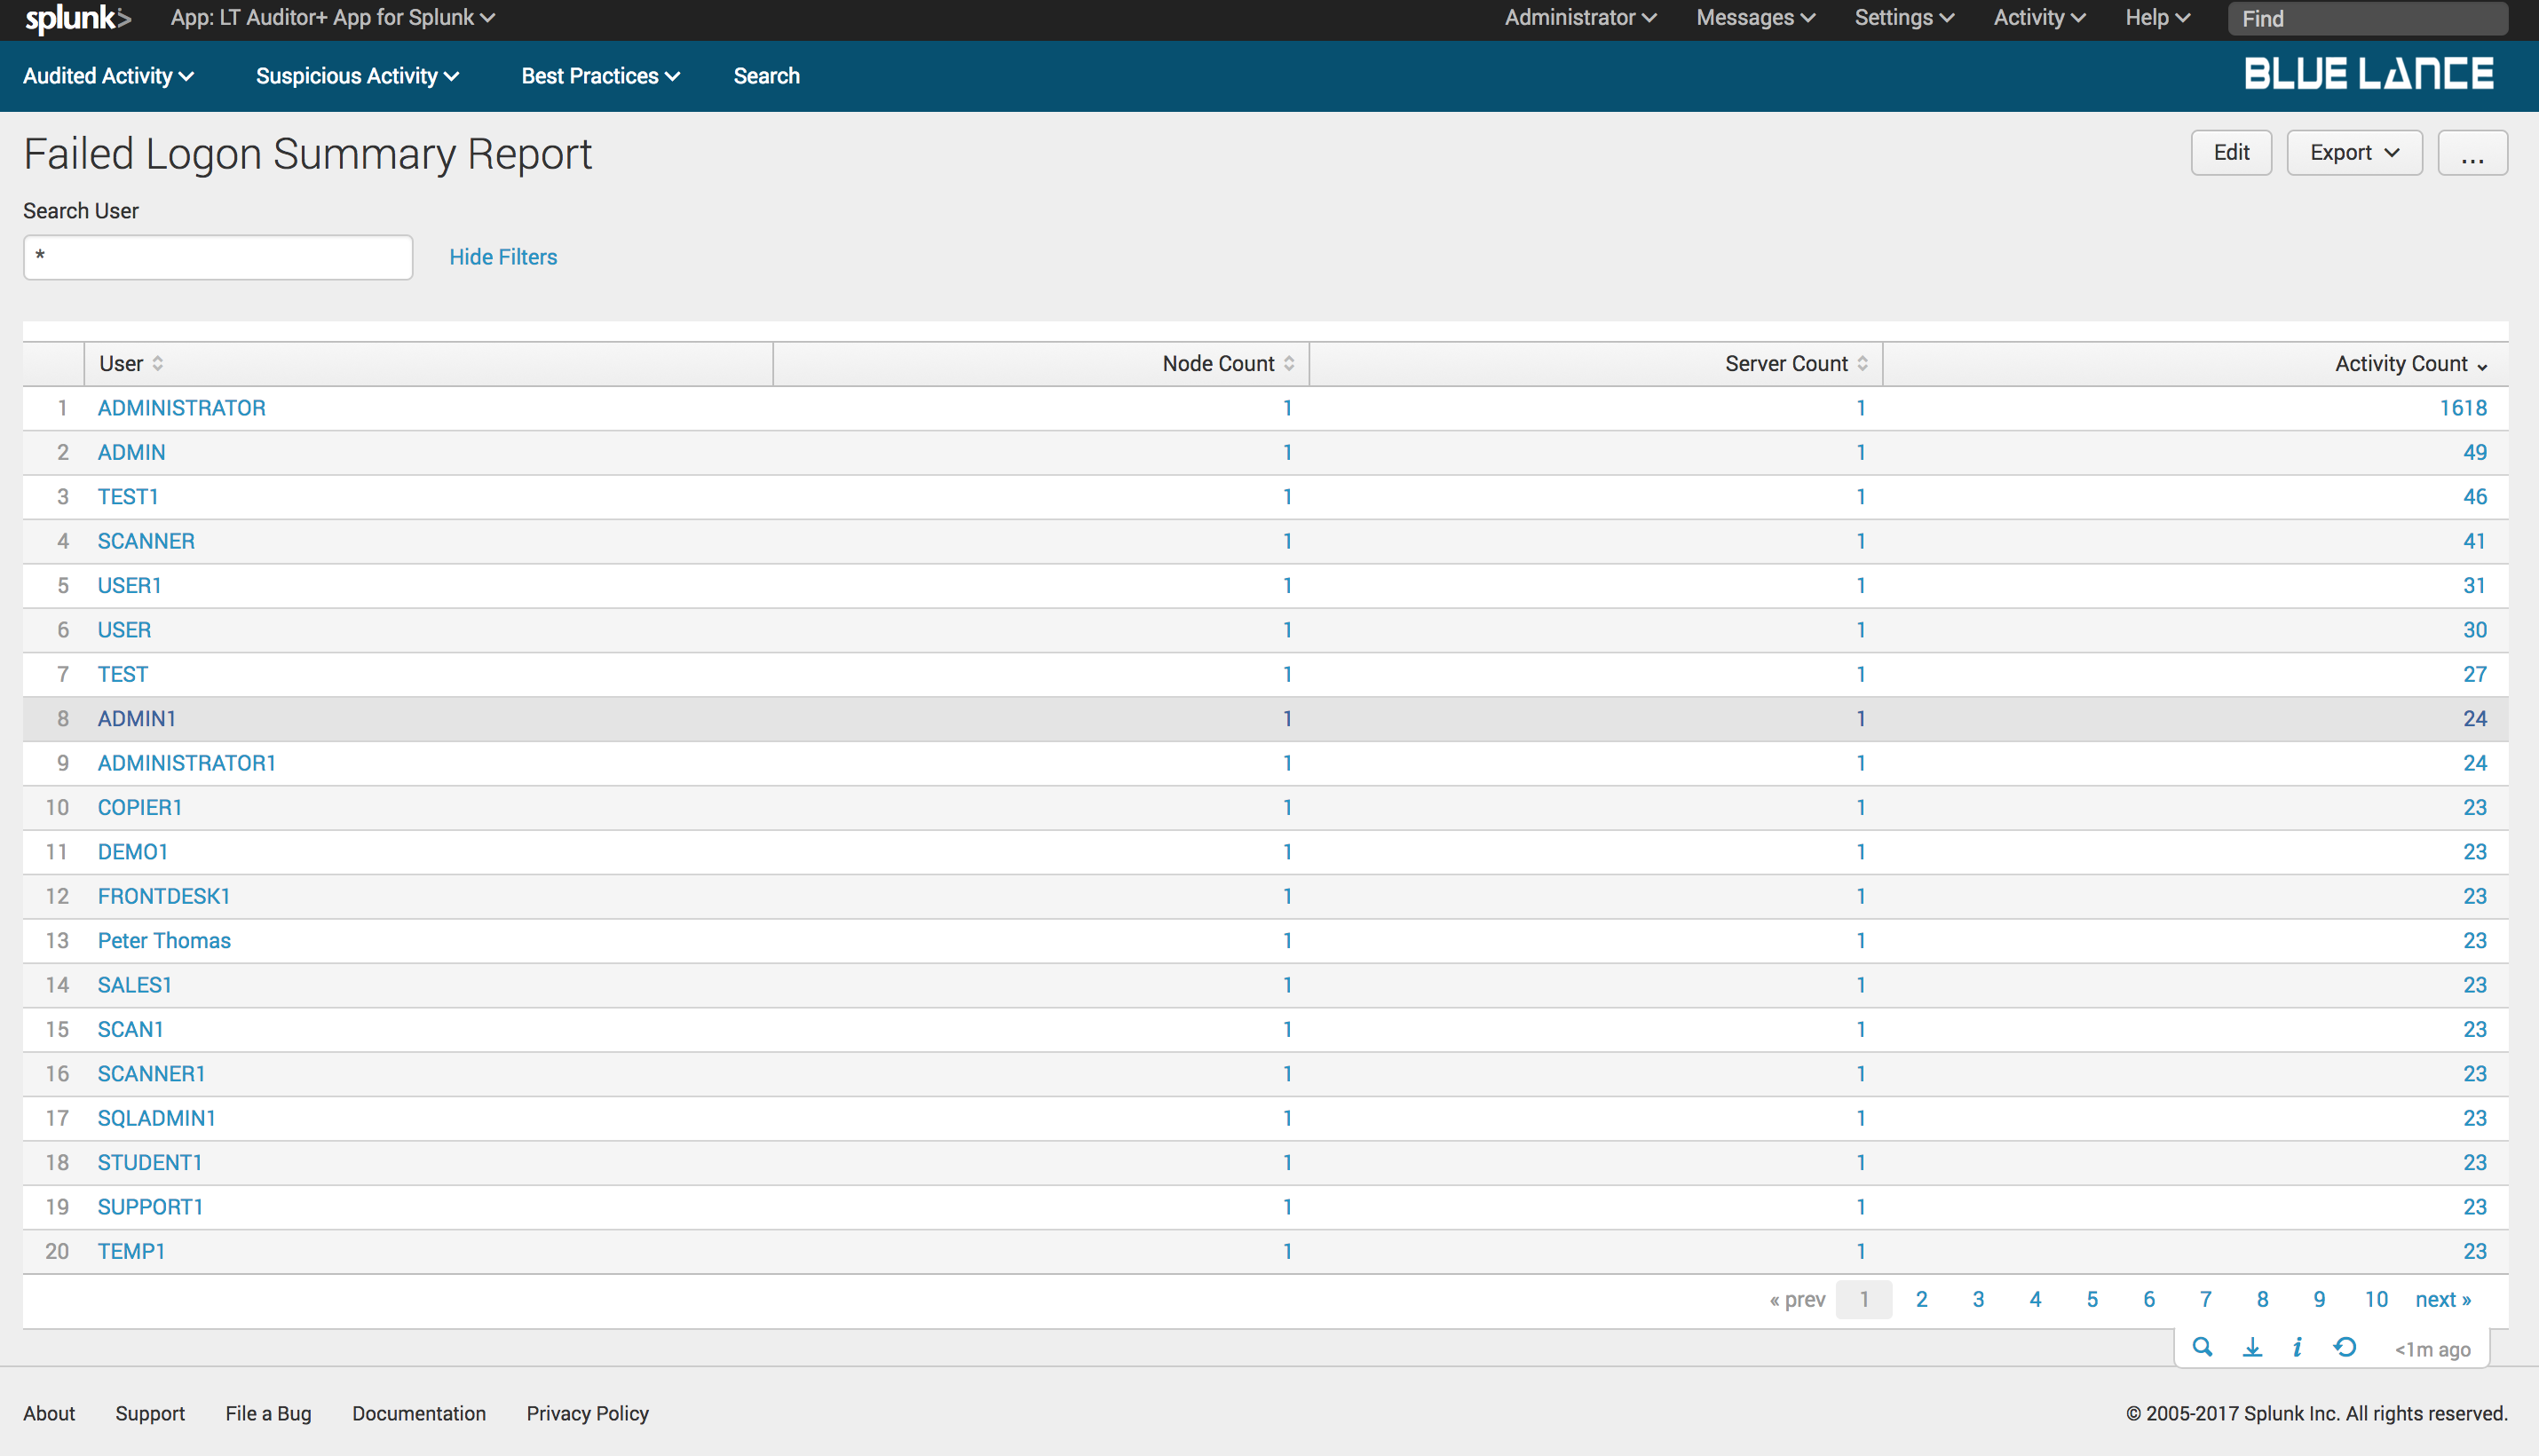
Failed Logons is a count of all failed login events collected as per filter criteria. Clicking on this notable generates a table summary of user failed activity with column counts of nodes, servers and activity count as shown below. Clicking on any of the users will generate a detailed report of failed logon activity for specified user.
8.Files/Folders Dashboard
The Files/Folders dashboard provides complete details of all file and folder activity recorded with LT Auditor+ as shown.
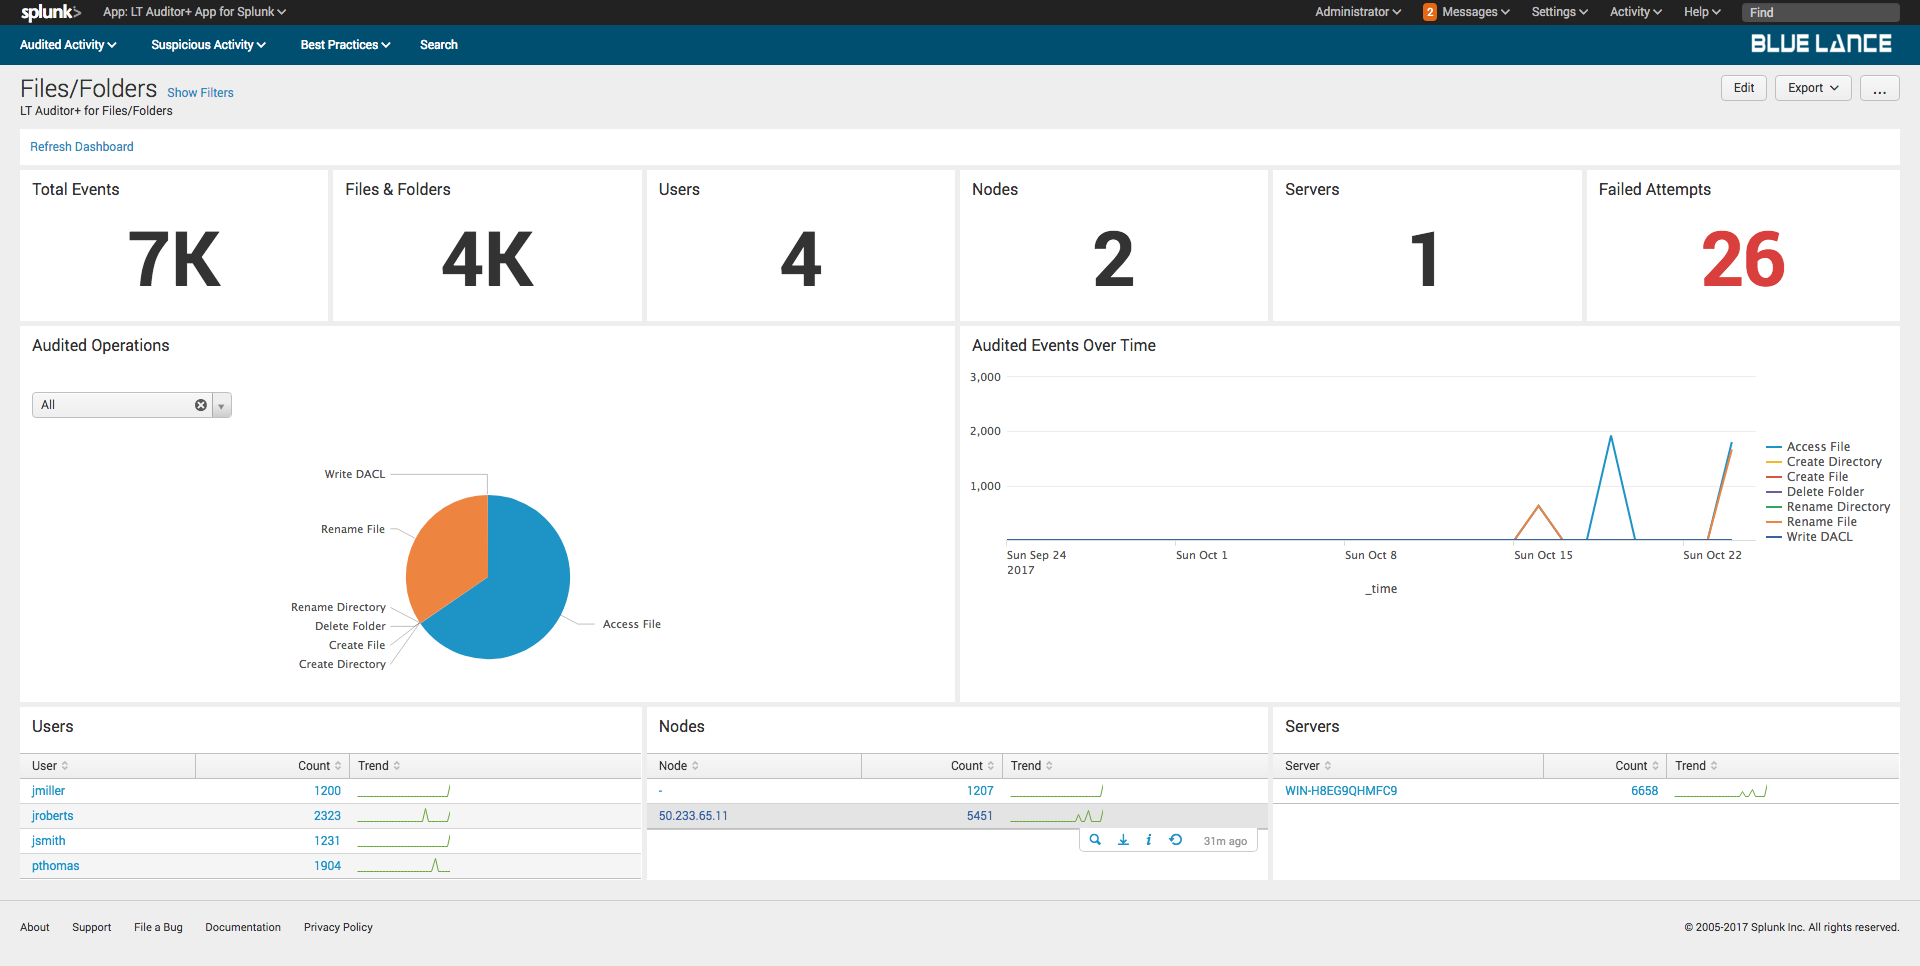
The dashboard has the following sections:
- Filters – Criteria can set to define content displayed on the dashboard;
- Notables – Summary of information about all activity that occurred;
- Audited Operations – Pie chart of specific operations for given filter criteria;
- Audited Events Over Time – Graphical representation of event modifications occurred for specified filter criteria;
- Users – List of all users making changes to cause the events to be recorded;
- Nodes – List of source nodes where changes were made from;
- Server – List of host servers where the changes occurred.
8.1.Filters
Click show filters to display query criteria for the dashboard as shown below. The dashboard will automatically update if criteria is specified in the filters.
Criteria can be configured based on:
- Time Frame
- Users
- Nodes
- Servers
- Filenames
8.2.Notables
The following section describe each of the Logon Server notables.
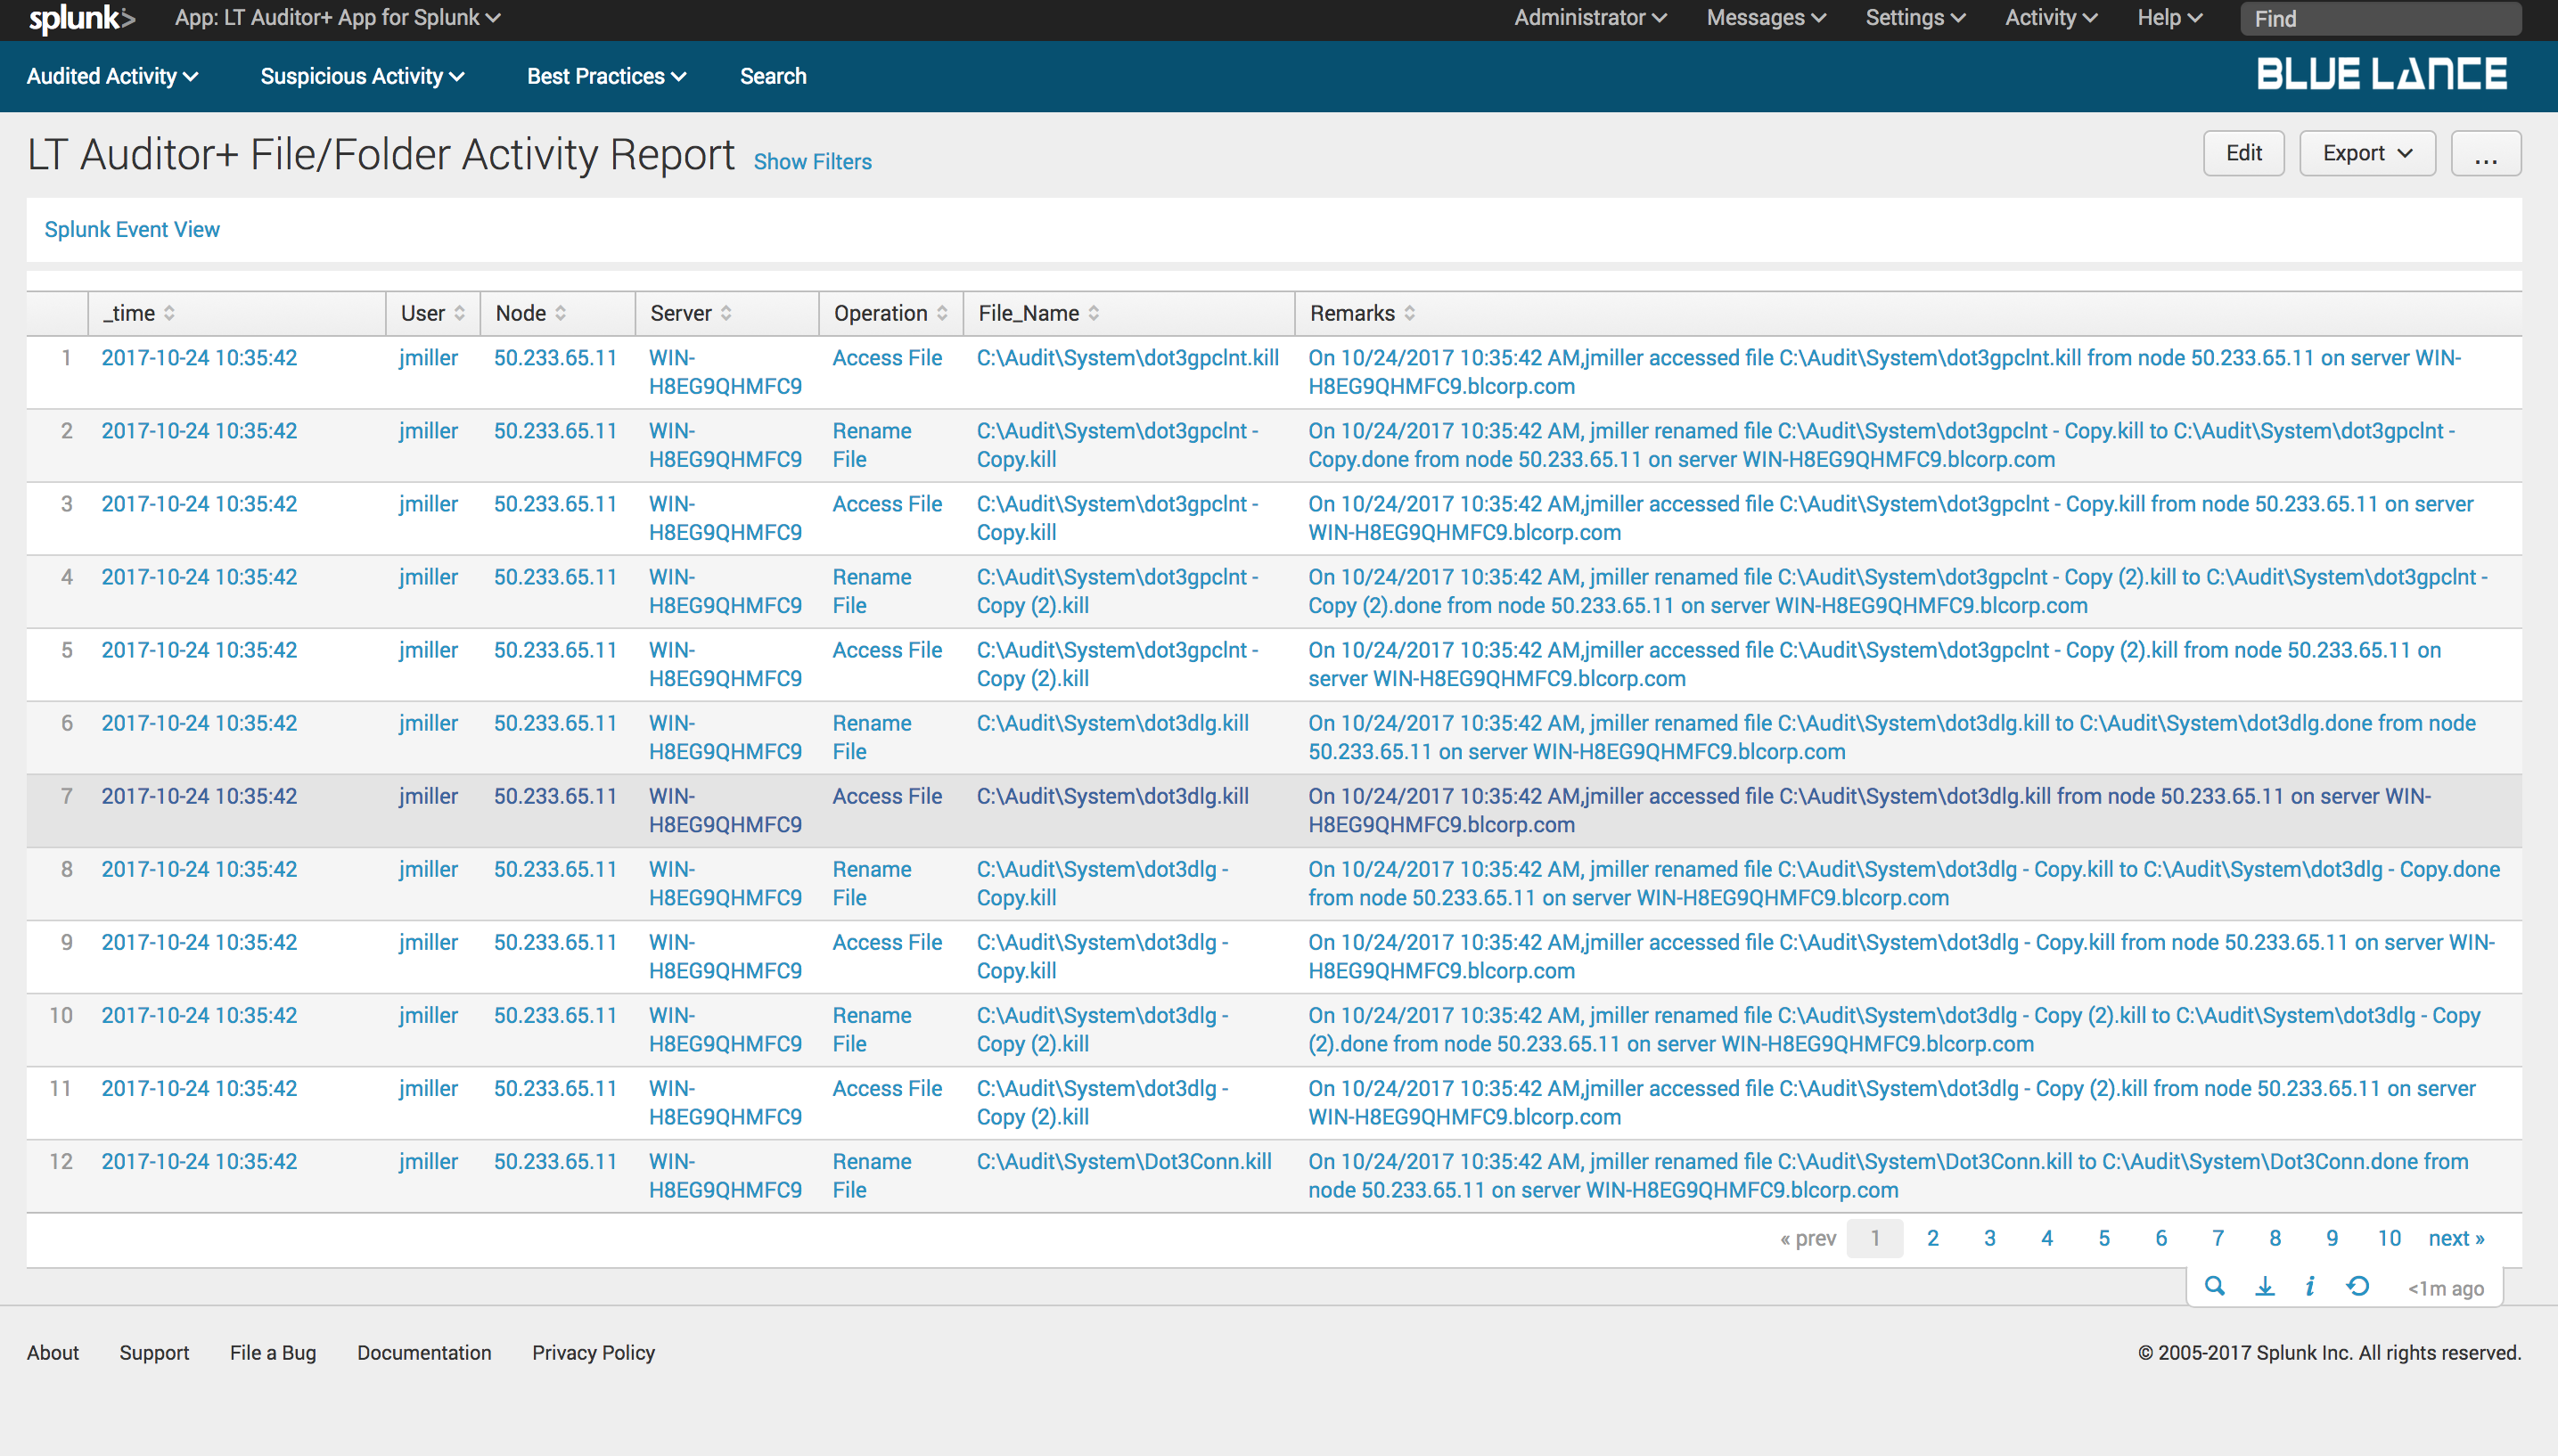
8.2.1.Total Events
Total Events is a count of all file activity collected as per filter criteria. Clicking on this notable will generate a report of those events as shown below.
8.2.2.Users, Nodes and Servers
These notables have the same functionality as described for the Active Directory dashboard.
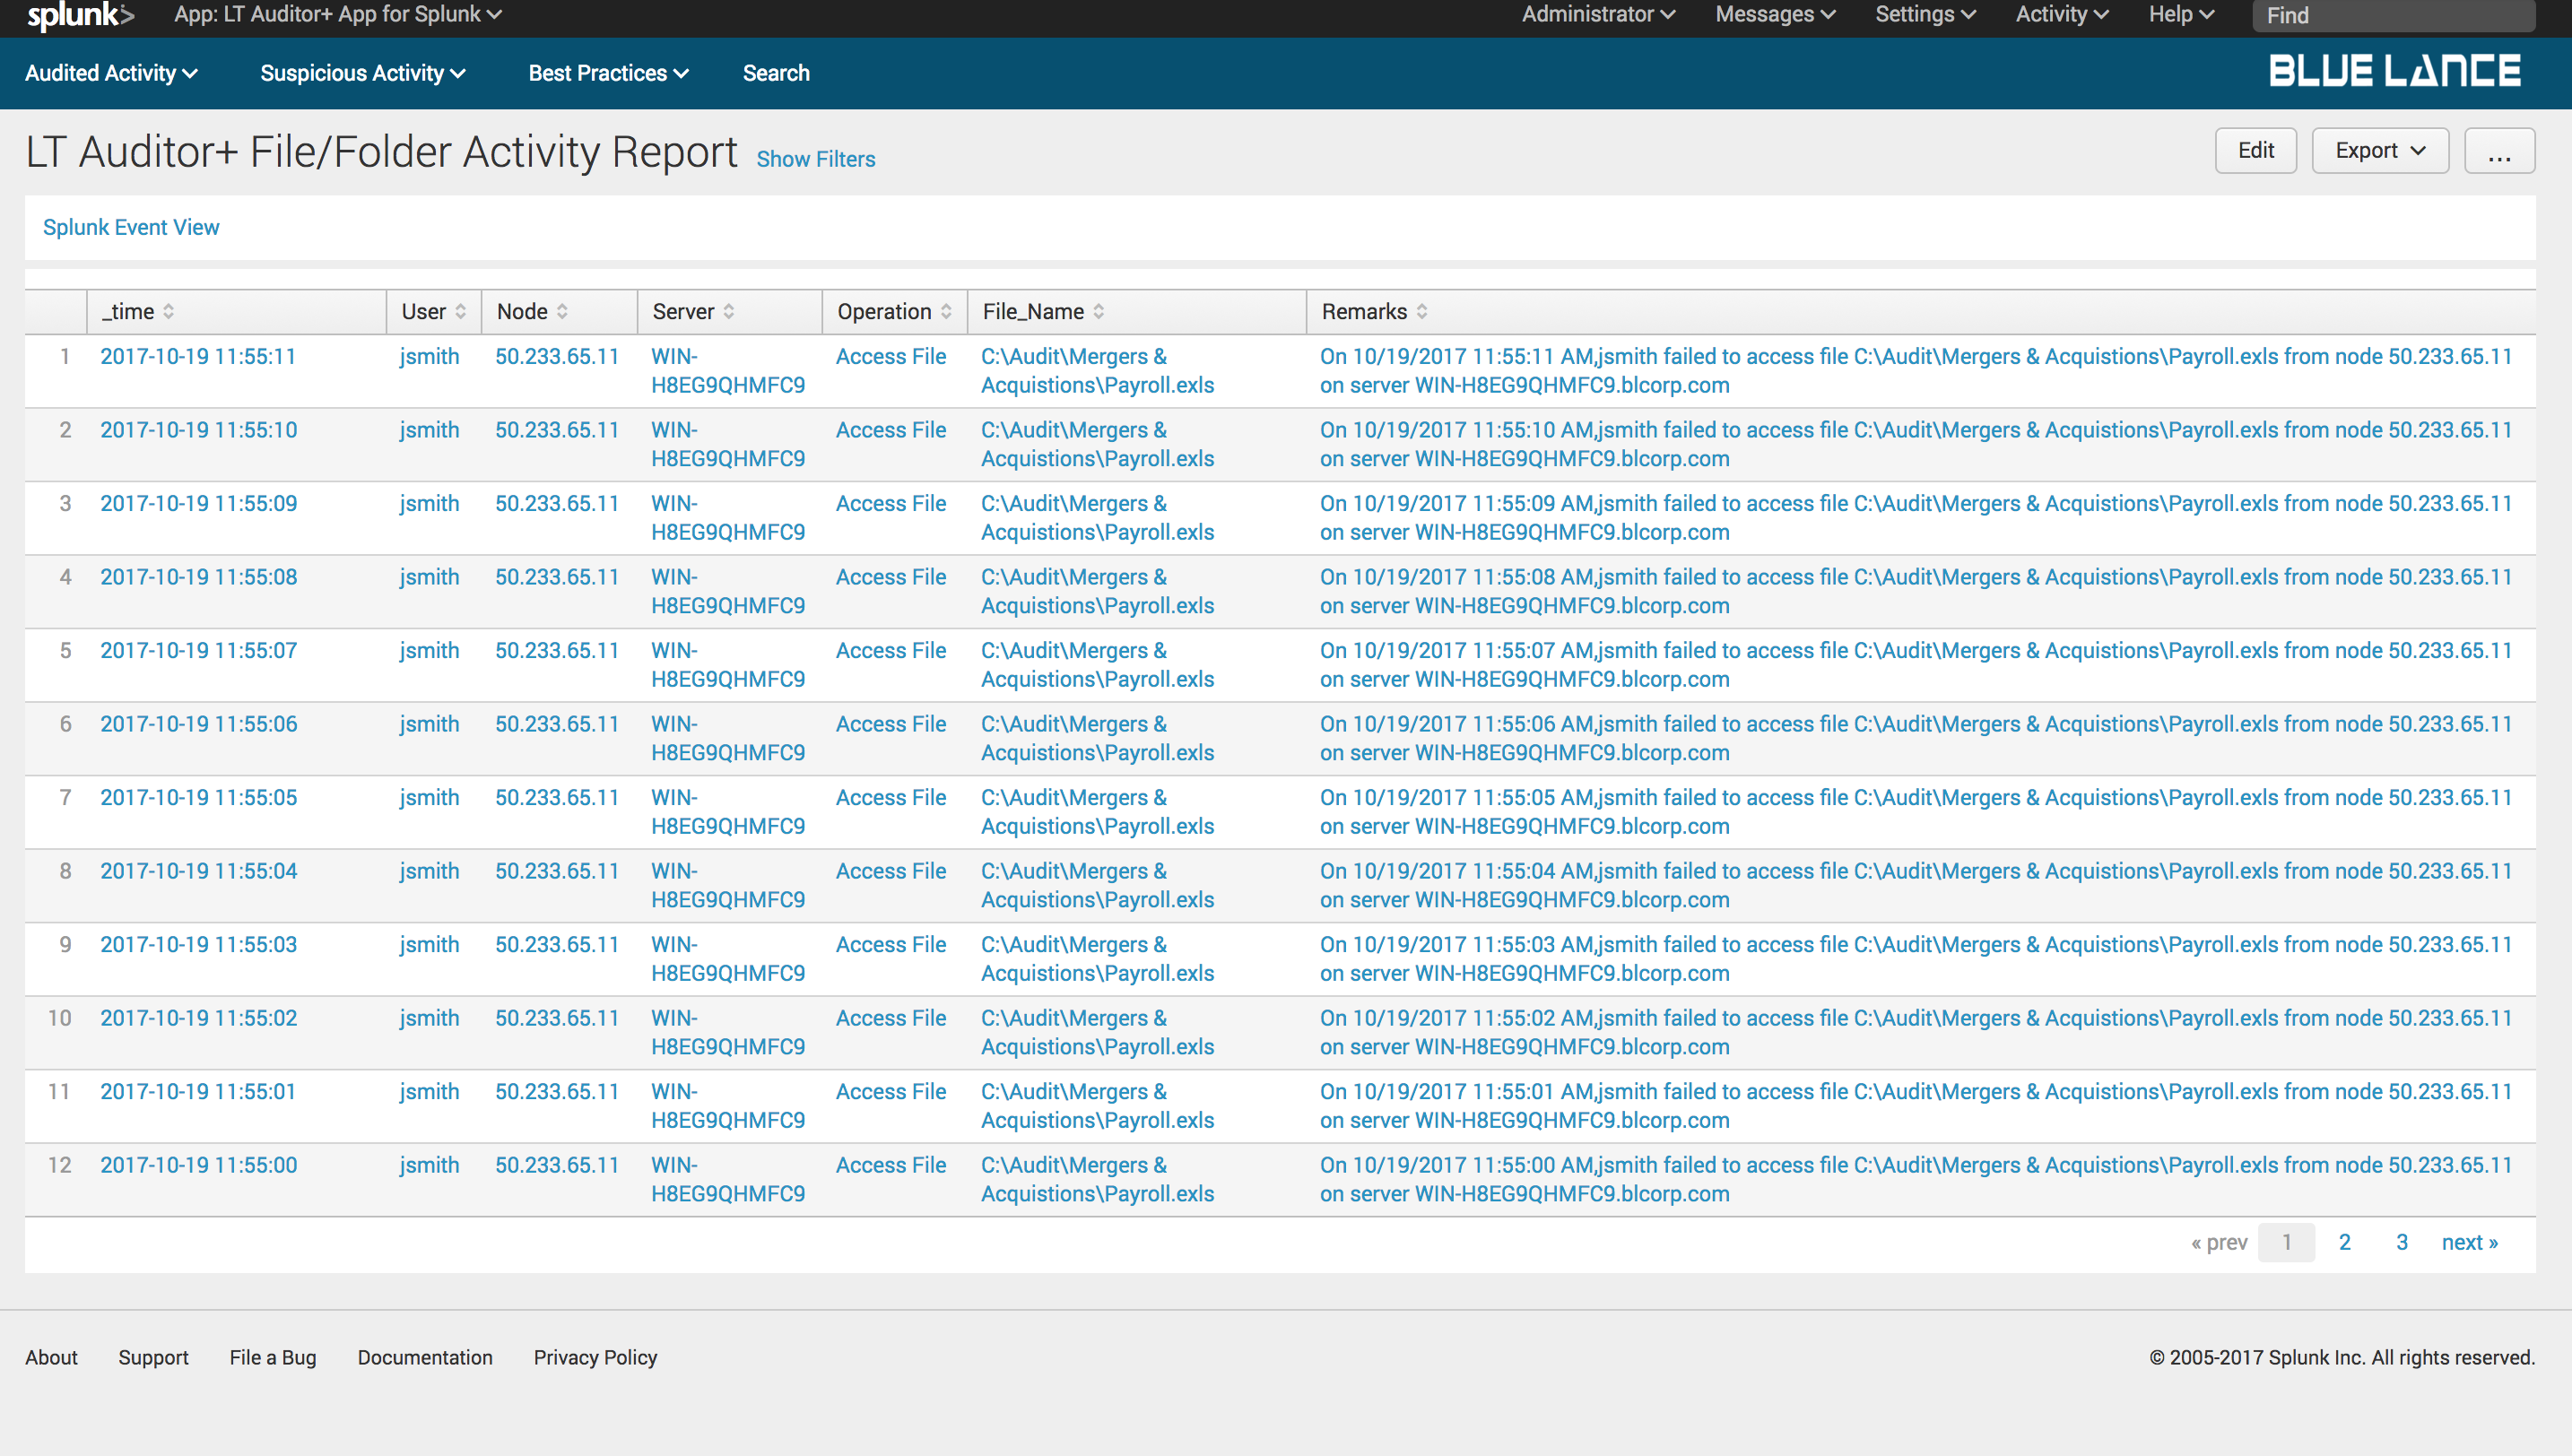
8.2.3.Failed Attempts
Failed Attempts is a report of all failed file activity collected as per filter criteria.
9.Suspicious Activity Dashboards
These dashboards provide insight to possible malware attacks in any organization.
9.1.Bulk Rename Operations
Ransomware attacks typically cause a lot of simultaneous rename operations as file get encrypted. Thisdashboardprovides details if more than 500 rename operations occurred, performed by the same user from the same node at the same time.
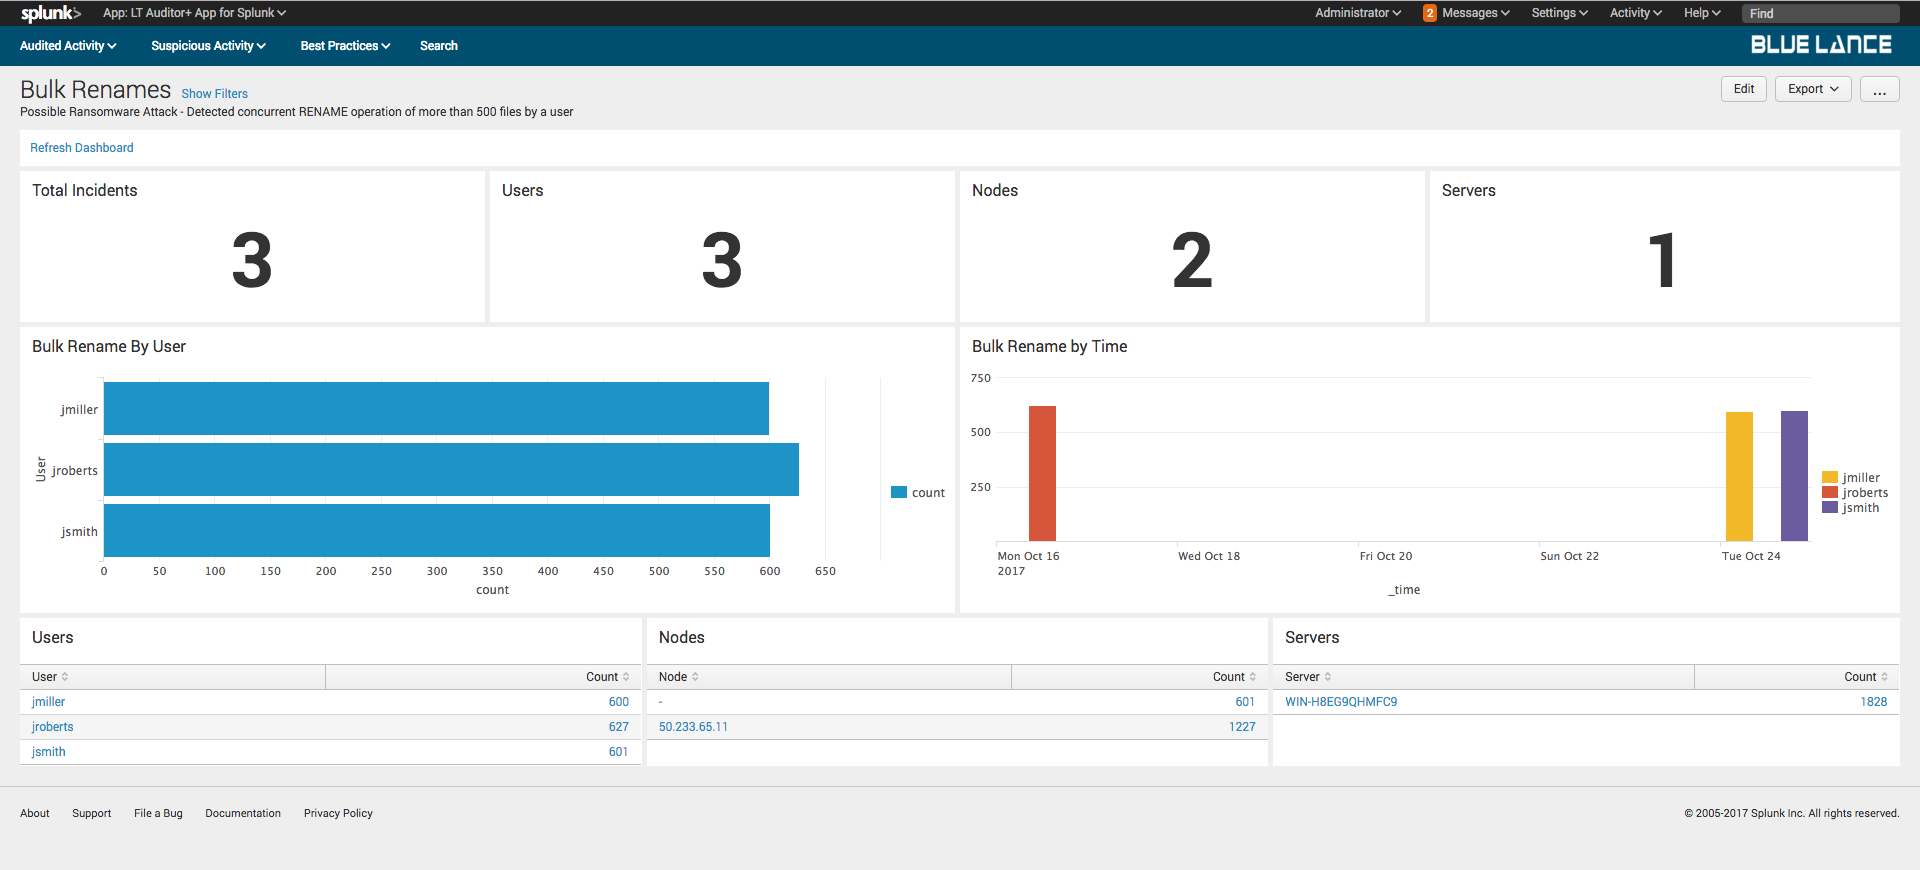
Clicking on a user will generate details about user’srename activity.
9.2.Bulk Copy Operations
Data exfiltration occurs when malicious actors access large numbers of files at the same time. This dashboard provides details if more than 500 files were accessed by the same user, from the same node at the same time.
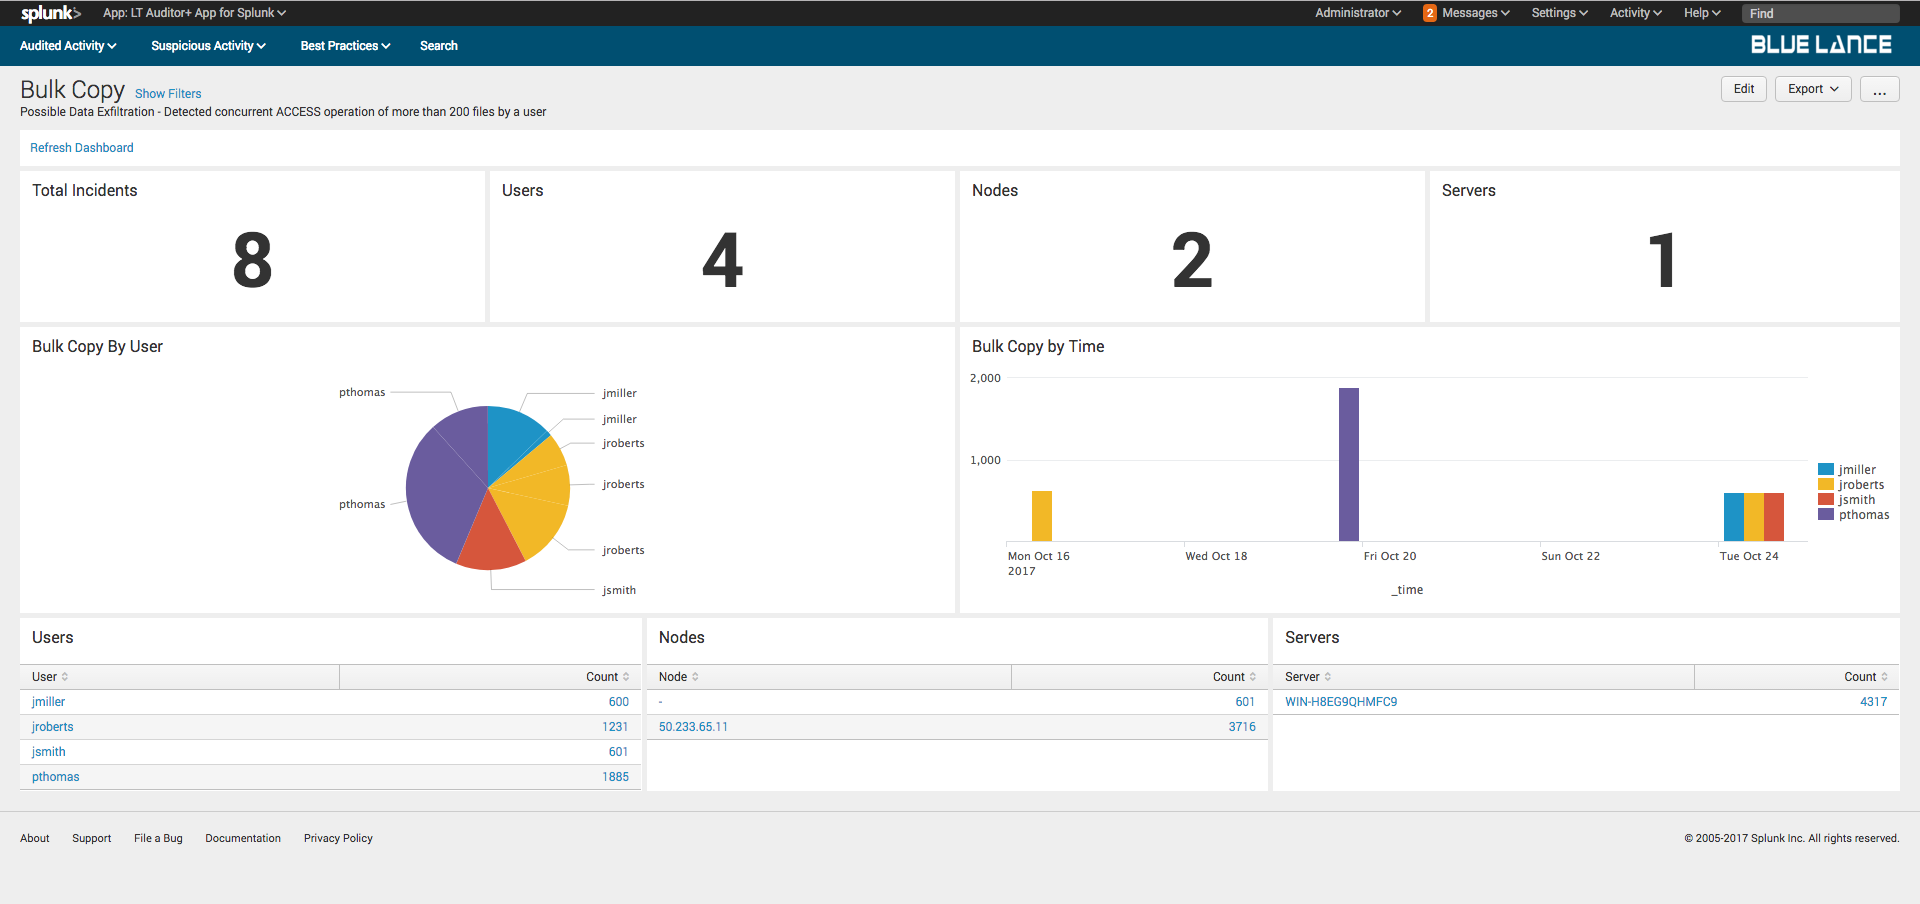
Clicking on a user will generate details about user’s access activity.
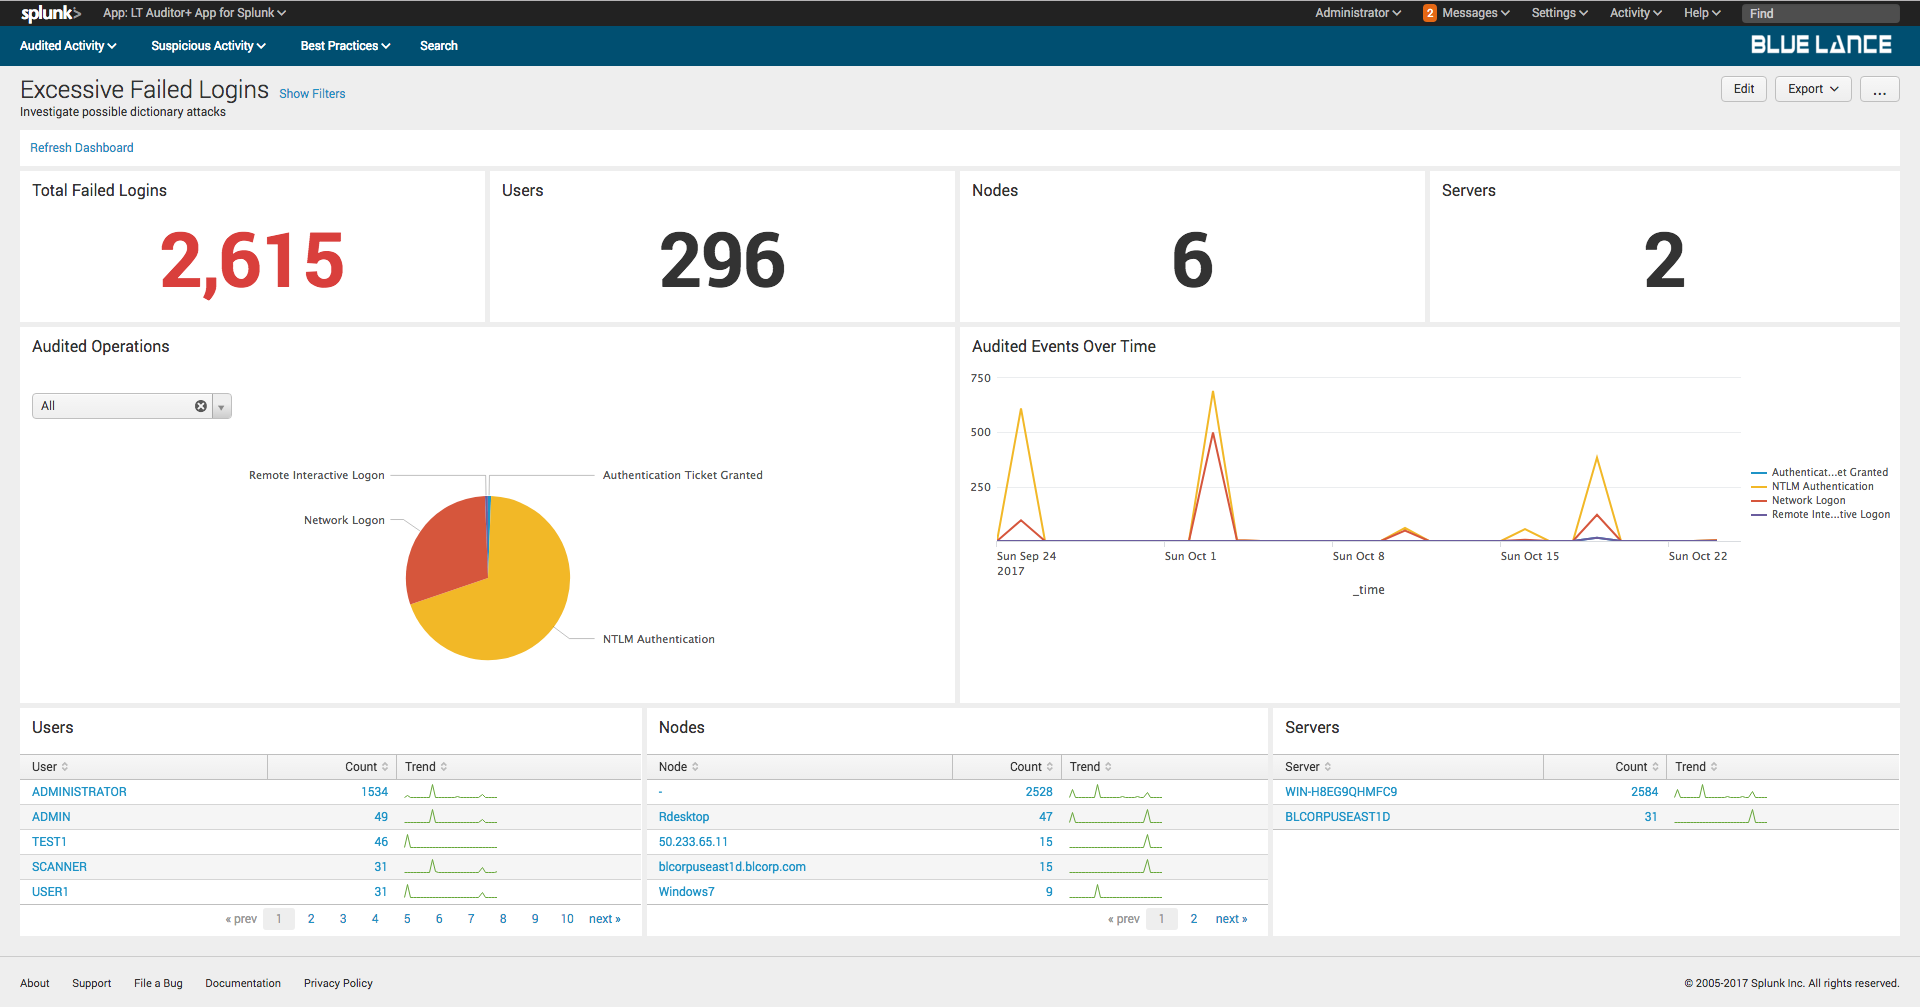
9.3.Excessive Failed Logons
Excessive failed logon activity always needs to be investigated to ensure that an organization is not being attacked. This dashboard provides details on all logon failures and the type of failure.
10.Best Practice Dashboards
These dashboards are a collection of best practices to monitor in an organization.
10.1.Elevated Privileges
This dashboard provides a quick view of privileges elevated for specified time frame.
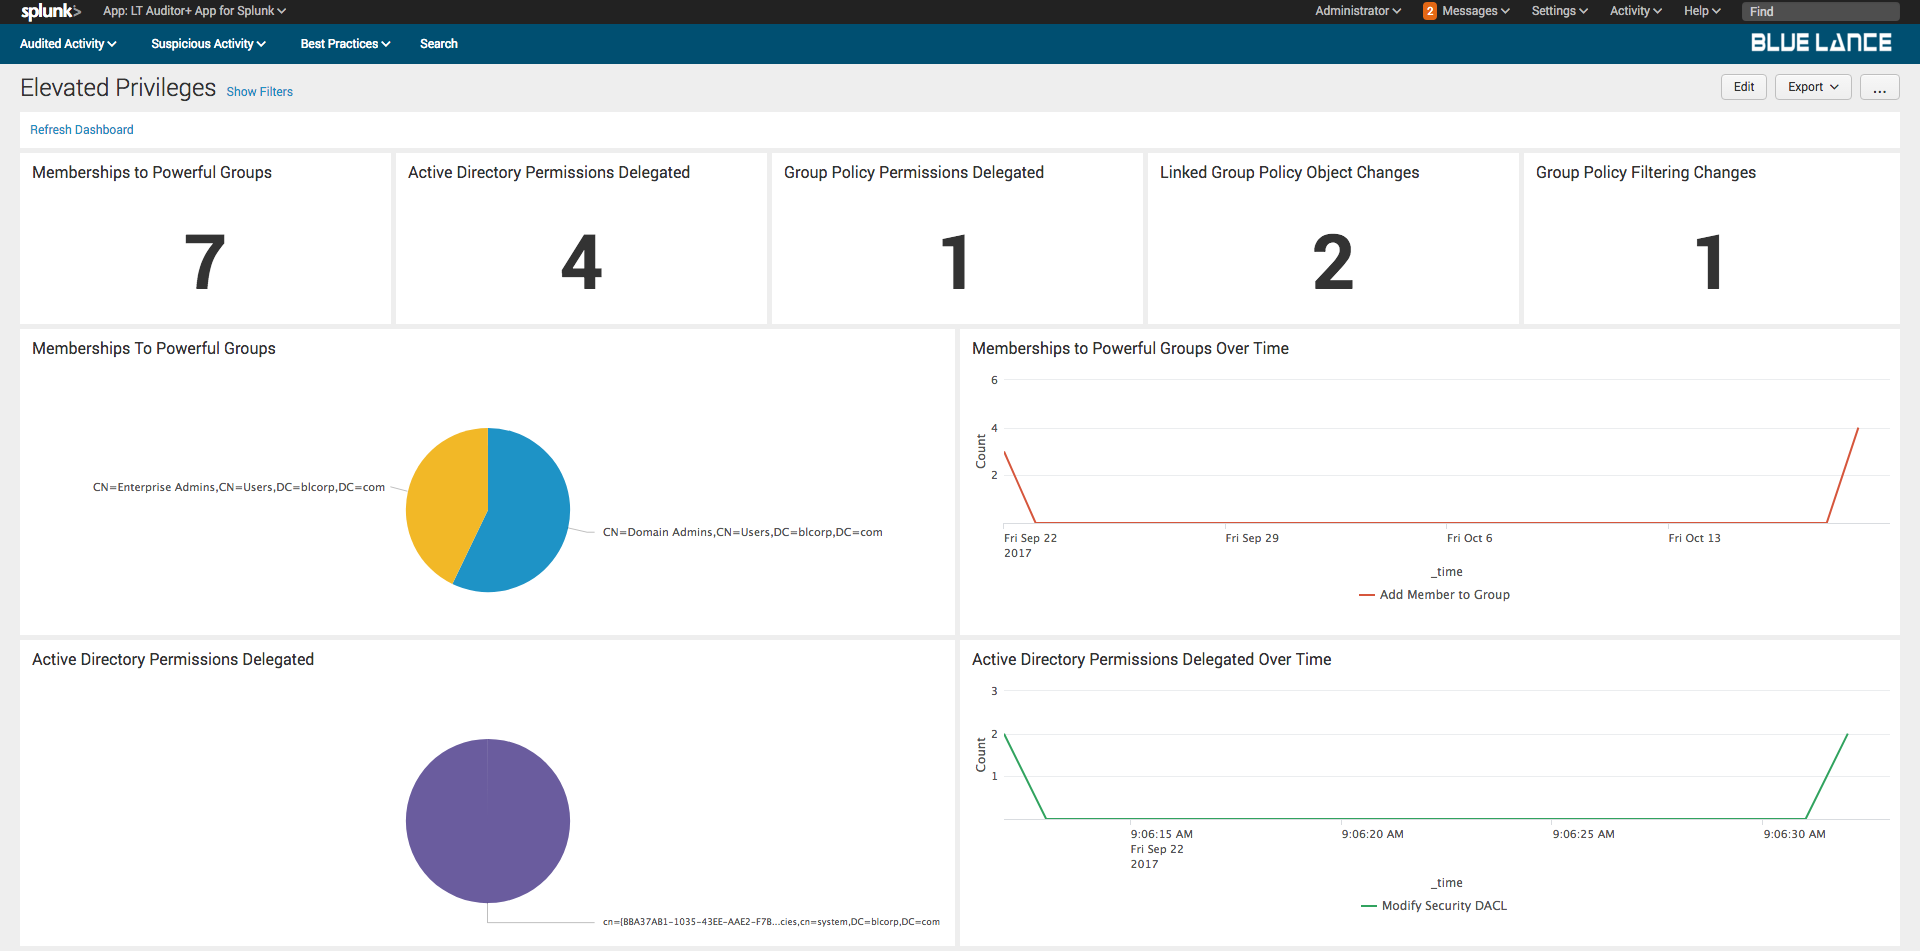
Privileges tracked are:
- Group memberships to powerful groups
- Active Directory permissions delegated
- Group Policy permissions delegated
- Linked Group Policies changed
- Group Policy Filtering changes
10.2.System Access
This dashboard provides a quick view access to the organization’s network that may require reviews.
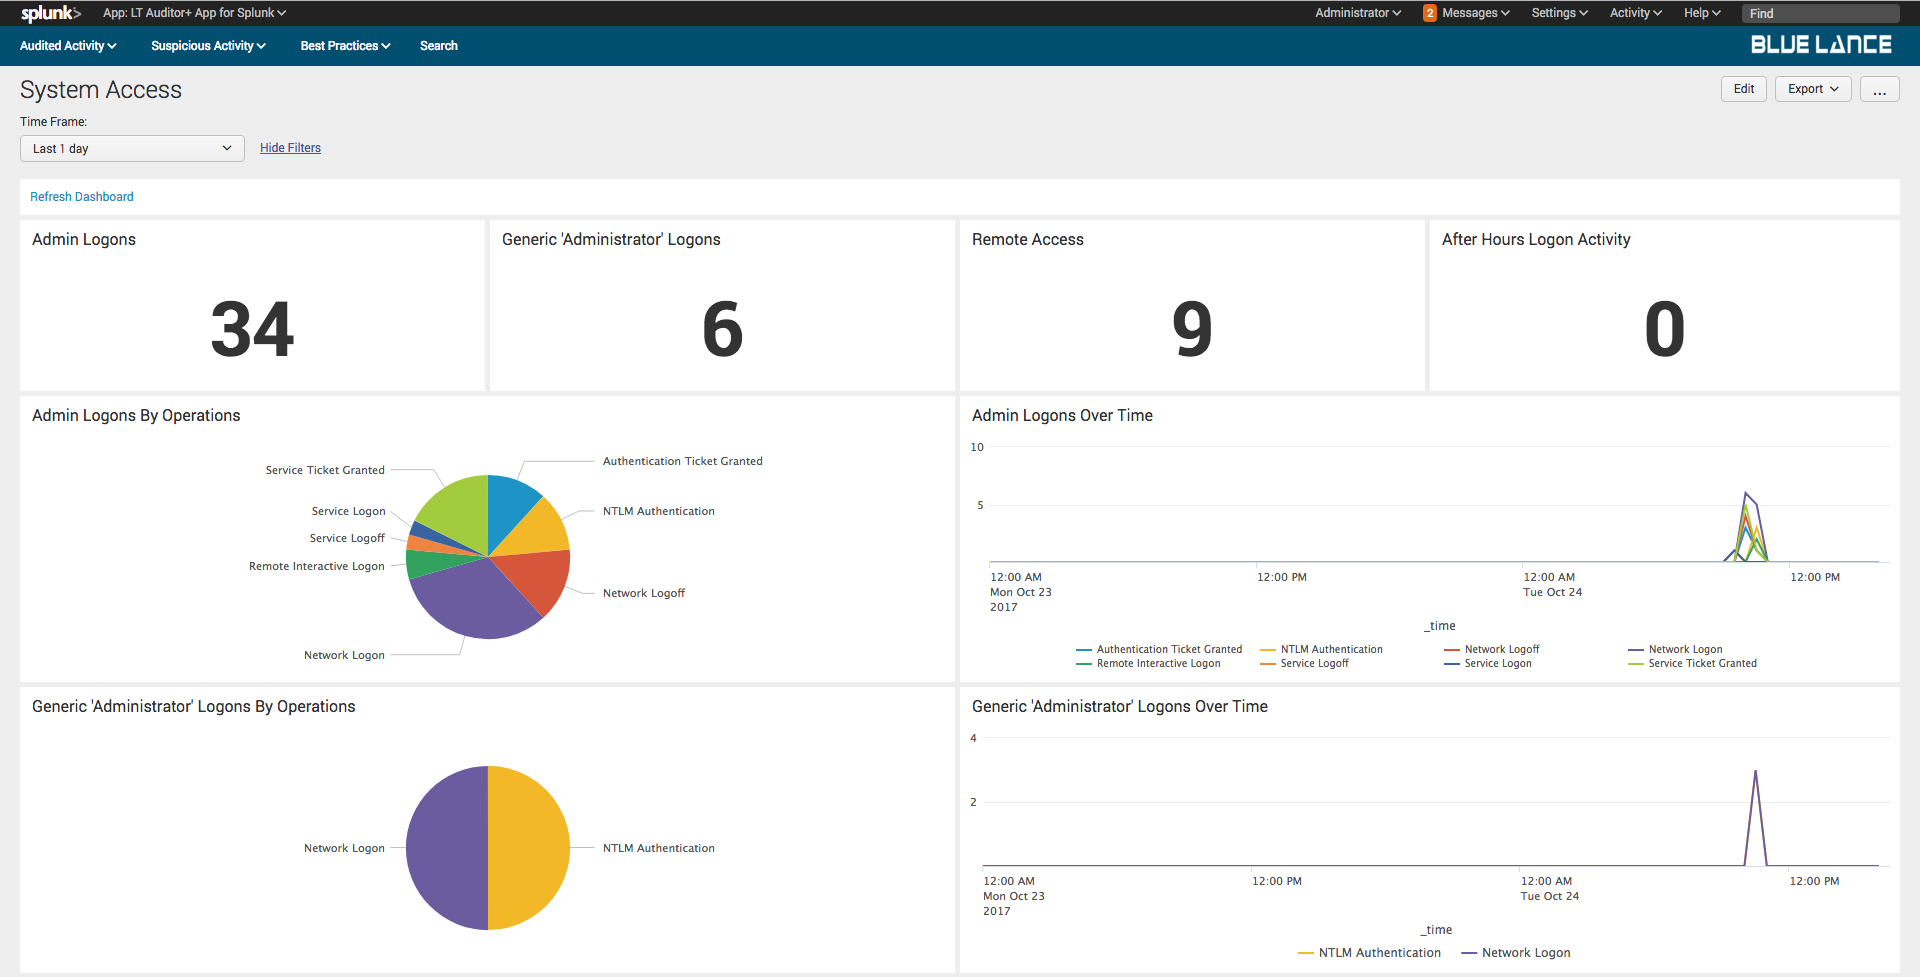
Access tracked:
- Admin Logons
- Generic ‘Administrator’ Logons
- Remote Access
- After Hour Logon activity
10.3.Policy Changes
This dashboard provides a quick view group policy modification critical for any organization.
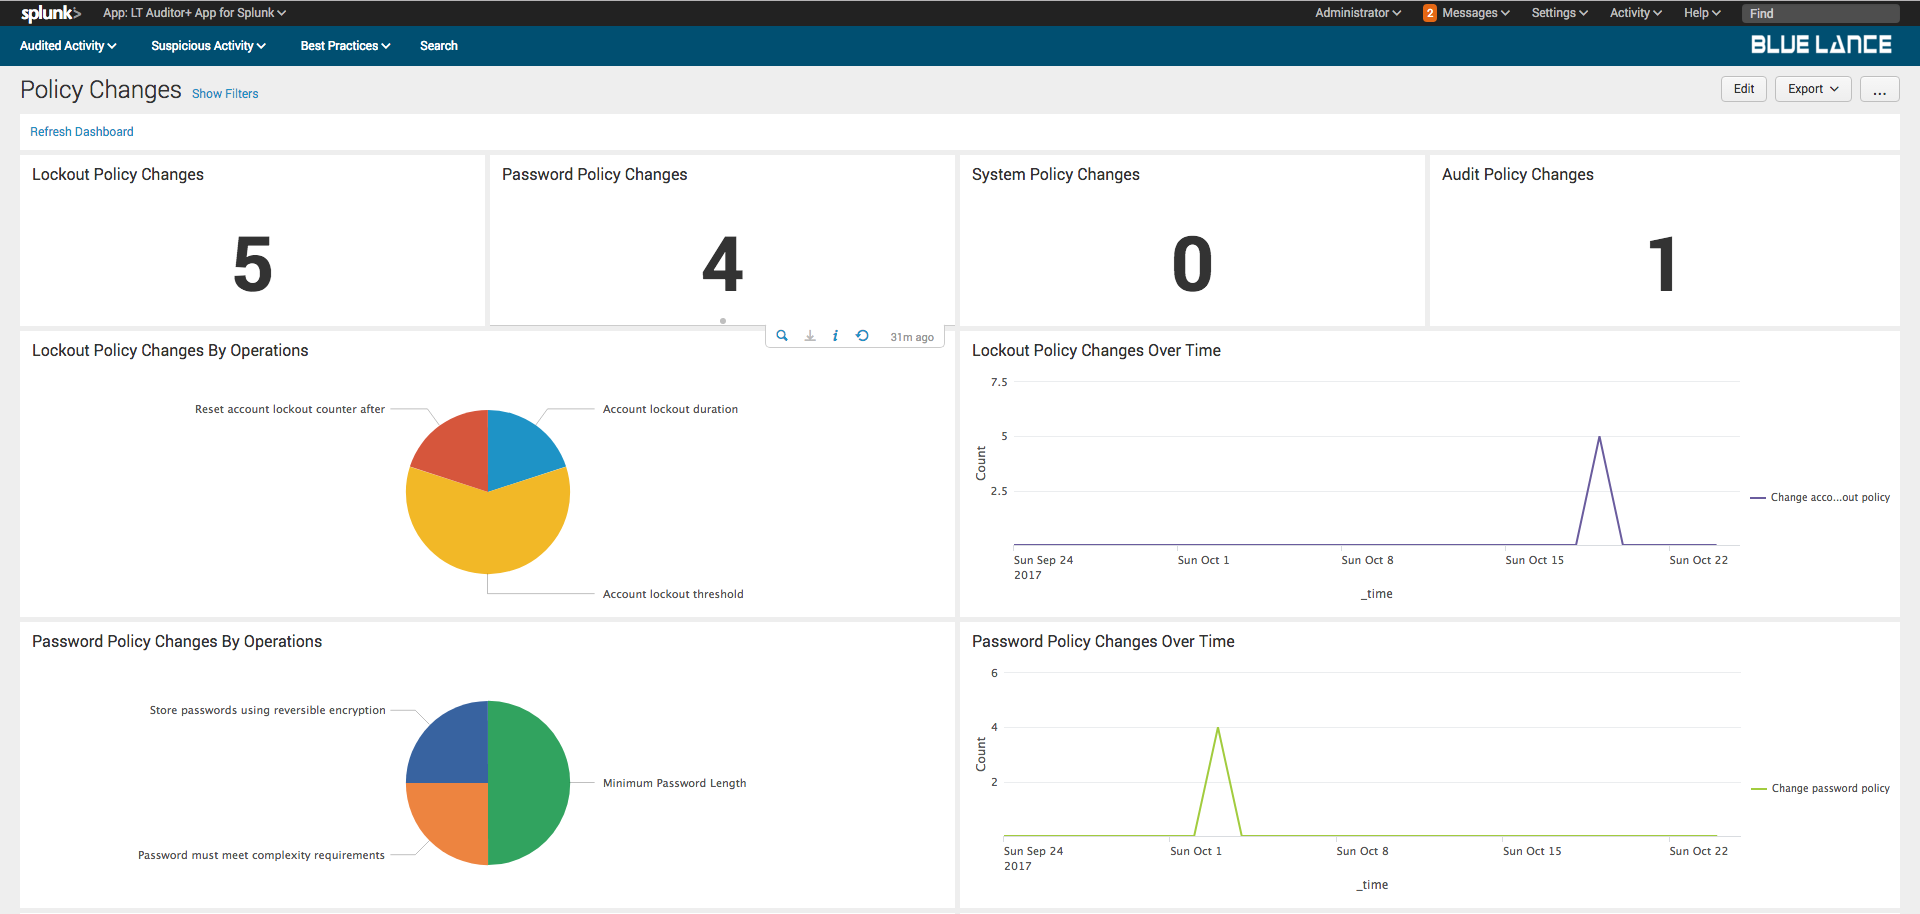
Policies tracked are:
- Lockout Policy Changes
- Password Policy Changes
- System Policy Changes
- Audit Policy Changes

